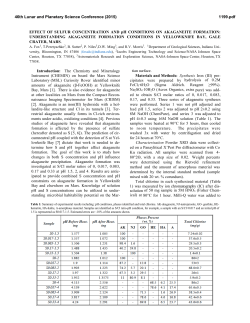
Iodo-THM Formation in High g Sodium Source Waters A.-M. Tugulea, R. Aranda-Rodriguez, M. Giddings, F. Lemieux, J. Hnatiw Health Canada, Ottawa, Canada Background National Survey of Disinfection by-Products in C Canadian di Drinking D i ki water t (2009-2010) (2009 2010) • First Canadian study of iodo iodo-DBP DBP (iodo (iodo-THMs THMs and selected iodo iodoHAAs) occurrence in water treatment and distribution systems. • 65 water treatment plants (WTPs) across Canada were investigated. • Bromide, iodide ion, total bromine and total iodine concentrations were determined. 2 Background (cont.) Findings: • Iodo-THMs were found in 74% (48/65) of the water systems tested under summer conditions. • Total iodo-THM concentration range: 0.02 μg/L to 21.66 μg/L. • The median value of the maximum total iodo-THM concentrations in systems with detectable concentrations was 0.17 µg/L, while the average value for the same data set was 1 1.2 2 µg/L µg/L. • In two WTPs the maximum total iodo-THMs was higher than 5 μg/L. μg/L 3 Background (cont.) Distribution of Water systems based on Total Iodo Iodo-THM THM concentration 25 20 15 10 5 0 <0.1 0.1-1 1-5 5-10 >10 Range of concentration (ug/L) Summer Winter 4 Background (cont.) Findings: • The highest total iodo-THM concentrations were found in the Canadian Mid-West, in non-coastal locations. • No correlation of total iodo-THM concentrations with Br - concentrations was found. • Total iodo-THM concentrations showed a good correlation with total iodine and iodide concentrations. • At locations where elevated levels of iodide were present in the source water, the total iodo-THM concentration was inversely correlated with the free chlorine concentration in the treated water. 5 Iodo-THM formation correlation to low free chlorine in treated water • WTP 30: Total iodo-THMs: 7.56 μg/L. The free chlorine concentration was 0.03 mg/L. Iodide was present in raw and treated water. • WTP 31: Total iodo-THMs: 1.2 μg/L. The free chlorine concentration was 0.89 mg/L. Iodide was present in raw water only. 35 Conc centration (µg/L L) 30 25 20 15 10 5 0 iodo-THMs Regulated THMs WTP 30 WTP 30 6 Geographic distribution of total Iodo-THM y) concentrations ((2009-2010 National Survey) Sampling Locations with Total IodoTHMs: < 1.0 µg/mL Between 1.0 and 5.0 µg/mL > 5.0 µg/mL 7 How do we identify water systems with potential for high iodo iodo-THM THM formation? • Is the potential to form iodo-THMs equally relevant for all treatment systems using chloramines? • Iodide or total iodine determinations, with required MDLs, are not partt off routine ti water t quality lit analysis l i in i many water t treatment t t t systems. • Total iodo-THM concentrations higher than 5 μg/L were found at WTPs using source water with Na+ conc. >200 mg/L, and where chloramines were formed (from added or naturally present NH4+ ). • Na+ concentration is considered in this study as a marker for higher bromide and iodide concentrations in the source water. 8 Current Study: a survey targeting water treatment y using g water sources with high g sodium content. systems Hypothesis: • High Na+ concentrations and the presence of ammonium in the source water can be a marker for water treatment systems that can be expected p to have a high g p potential for the formation of iodo-THMs. • Total iodo-THM concentration and speciation in such systems are correlated to the free chlorine concentration in the treated water water. • Iodo-THM speciation in such systems is correlated to the bromide concentration t ti in i th the source water. t 9 Current Study: design • 16 WTPs s in two Canadian Provinces,, with source water DOC ranging g g from 0.62 mg/l to 17 mg/L. • Na+ concentrations in source water ranged d from 10 mg/L to 760 mg/L 10 systems have Na+ concentrations >200 mg/L. • Source water has naturally occurring NH4+ ranging from <0.05 mg/L to 2.7 mg/L. • All WTPs in the study use ammonium in the treatment train and/or have naturally occurring ammonium. • This study also investigated other potential water contaminants: CNCl; CNBr; nitrosamines, bromate, perchlorate. 10 Study locations: map 11 Sampling and Analytical Method • • Sampling protocol: 65 mL brown glass bottles; no headspace, 0.114 M ascorbic acid for quenching; pH lowered to 4.5 4 5 using 0.1 0 1 N HCl. HCl Stability studies: iodo-THM concentrations were stable for more then 2 weeks, if samples were kept cool (< 100C) and in g the absence of light. MDL (µg/L) Chemical name Dichloroiodomethane DCIM 0.02 Bromochloroiodomethane BCIM 0.05 Dibromoiodomethane DBIM 0.03 Chlrodiiodomethane CDIM 0.05 Bromodiodomethane BDIM 0.05 TIM 0.02 Triiodomethane (iodoform) 12 Sampling and Analytical Method • • Iodo-THM samples were analysed using an automated SPME-GCECD method. Possible interference by 32 other neutral DBPs was assessed. Fig1. Chromatogram of iodo-THMs separated from a solution containing 32 other neutral DBPs (iodoTHMs 10 μg/L, except iodoform 2 μg/L; other DBPs 5 μg/L, except THM-1 25 μg/L) 13 RA10 Sampling and Analytical Method • Presence of the analytes in the sample was confirmed by spiking the p with the iodo-THM standard mix. samples Fig 2. Overlay of a sample spiked with iodo-THM standard mix (0.25 μg/L iodo-THM, except iodoform 0.125 μg/L) chromatogram (red) over original sample chromatogram (blue)for confirmation 14 Slide 14 RA10 is this a different method from the one used in the National Survey? Rocio, 02/10/2014 Quenching and iodo-THM stability • Laboratory experiments demonstrated that iodoform is not stable in drinking water water, if free chlorine is present present. Recovery of spiked iodoform concentrations were much lower in unquenched drinking water samples as compared to quenched samples. Fig. 3 Chromatogram of iodoform spiked (0.125 μg/L) in unquenched finished water (red) and finished water quenched with ascorbic acid 0.0114m (blue). 15 Results: concentration range and speciation • For WTPs with Na+ source water concentrations>200 mg/L, the range of maximum total iodo-THM iodo THM concentration formed was 0 0.76 76 µg/L to 26.82 µg/L, with an average of 8.11 µg/L and a median value of 3.16 µg/L. These values were much higher than the average and g the 2009-2010 National Survey. y the median value obtained during 2009/2010 National Survey 2012/2013 Targeted Survey Number of sites investigated 65 16 % of sites with Na+ concentration>200 mg/L 62 6.2 62 5 62.5 Maximum total iodo-THM concentration Average value 1.2 µg/L 8.11 µg/L Maximum total iodo-THM concentration Median value 0 17 µg/L 0.17 3 16 µg/L 3.16 16 Results: concentration range and speciation • 8/10 WTPs with high sodium source water had maximum total iodoTHM concentrations > 1 µg/L and 4/10 WTPs had concentrations > 10 µg/L. • In the 4 WTPs with total iodo-THM concentrations > 10µg/L, the dominant species formed was iodoform (CHI3). The highest iodoform concentration, 16.28 µg/L, was found in treated water from WTP7 in WTP7, i the th summer. 17 Results: Maximum total iodo-THM concentration and dominant species formed in the treated water from 16 WTP Site Max. Total Iodo-THM in treated water (µg/L) Dominant Iodo-THM [Na+ ] In Source water (mg/L) Free chlorine in Treated water (mg/L) Bromide In SourceWater (mg/L) 2 0.73 DCIM 620 1.55 no sample 3 10.92 CHI3 580 0.38 0.9 4 10.48 CHI3 530 0.05 1.3 5 4.08 DBIM 410 0.64 0.67 6 26.82 BCIM; CHI3 420 2.5 0.73 7 21.54 CHI3 440 0.06 1.49 8 1.47 DCIM 390 0.8 0.42 9 2.07 CHI3 760 0.03 2.55 10 2.25 DBIM 420 1.38 0.84 11 0.76 DCIM 240 0.19 0.59 12 0.4 DBIM 54 0.11 0.08 13 1.59 DCIM 51 2.08 0.09 44 1.32 0.12 14 15 0.09 DBIM 11 1.35 0.05 16 0.2 DCIM 32 1.5 0.05 80 0.72 0.29 17 18 Results: Iodo-THM speciation and free chlorine concentration in treated water Concen ntration (µg/m mL) 18.0 16.0 14.0 12.0 10.0 8.0 6.0 4.0 2.0 00 0.0 DCIM BCIM DBIM CDIM BDIM CHI3 WTP11-Free Chlorine=0.19 mg/mL; g/ ; Bromide=0.59 mg/mL g/ WTP5-Free Chlorine=0.64 mg/mL; Bromide=0.67 mg/mL WTP7-Free Chlorine=0.06 mg/mL; Bromide=1.49 mg/mL 20 Conclusions • Na+ concentrations > 200 mg/L and the presence of ammonium in the source water are good markers for water treatment systems that can be expected to have a high potential for the formation of iodoTHMs. • Iodo-THM total concentration and speciation in such systems are correlated to the free chlorine concentration. • Iodo-THM speciation in such systems does not appear to be directly correlated to the bromide concentration in the source water. water 21 References • Richardson S. D., Global Nest Journal, 2005, 7, 43-60. • Richardson, S. D., Fasano, F., Ellington, J. J., Crumley F. G., Buettner, K. M., Evans,J. J., Blount, B., Silva, L. S., Waite, T. J., Luther, G. W., McKague, A. B., Miltner, R. J Wagner E. J.,Wagner, E D D., Plewa, Plewa M. M JJ., Environ. Environ Sci Sci. Technol Technol. 2008 2008, 42, 42 83330 83330-8338 8338. • Bichsel, Y.,von Guten, U., Environ. Sci. Technol. 2000, 34, 2784-2791. • Bruchet, A.;N'Guyen, K.; Mallevialle, J.; Anselme, C. Proceedings of AWWA Annual Conference; Los Angeles, CA, 1989; pp 125-141. • Goslan, E. H.; Krasner, S. W.; Bower, M.; Rocks, S. A.; Holmes, P; Levy, L.S.; Parsons, S. A. Water Research, 2009,43, 4698-4706. 22 Acknowledgements • Data presented here were collected as part of the Targeted Survey of Selected Disinfection By By-Products Products in source waters with high saline concentrations, a 3 year study funded by the Health Canada Monitoring and Surveillance Fund as part of the Chemical M Management t Plan Pl (CMP). (CMP) • The authors would like to thank the members of the Canadian Federal-Provincial-Territorial Federal Provincial Territorial Committee on Drinking Water for their gracious help in providing data for the site selection and the water plant operators for agreeing to participate in the study. • The authors would like to thank Ashley Cabecinha and Zhiyun Jin for their technical support. 23
© Copyright 2026 ExpyDoc