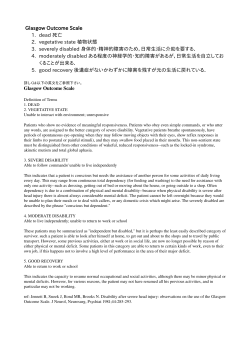
MARCH 2014 #londoncostofliving London Cost of Living Report Falling Further Behind Jennette Arnold OBE AM GREATERLONDONAUTHORITY | LONDONASSEMBLYLABOUR FOREWORD Welcome to this report, which shows how the rising cost of living in London has impacted on people across the city – especially those from Black, Asian and Minority Ethnic (BAME) backgrounds. Following a survey of over 2,000 Londoners, this report outlines how BAME people – as well as other groups protected by the Equality Act 2010 – have been affected by the rising costs of living in London. Since May 2010, the Government has made cuts to the public sector at an unprecedented rate. Additionally, Londoners have seen gas and electricity prices increase, as well as travel costs and private rental costs. This is compounded by the fact that median annual wages have decreased in real terms. All this has led to a cost-of-living crisis for people across London and has left millions of Londoners with incomes below the minimum required for an acceptable standard of living. The evidence shows that Londoners from BAME communities have been particularly adversely affected by recent Government policy and the rising costs of living, and I have spoken to many people in my constituency who have told me devastating stories about how the cuts have made an impact on their lifestyle. For instance, the bedroom tax, Personal Independence Payment (PIP) (formerly Disability Living Allowance (DLA)), the removal of the Education Maintenance Allowance (EMA) across England, large-scale cuts across the public sector, alterations to public sector pensions , the raising of the retirement age and cuts to tax credits. This report gives an overview of how the cost-of-living crisis is affecting different groups across London and concludes that the reduction in people’s income through wages and benefits – together with the increase in the costs associated with living – has led to more and more people struggling to make ends meet. This is particularly stark when we look at certain groups protected under the Equality Act 2010. As such, this analysis has used current intelligence to set out a list of clear recommendations to tackle this problem – in the short and longer term. These include using an Equality Scorecard for monitoring metrics related to equality; and schemes aimed at directly tackling unemployment, high transport costs, the lack of free school meals and housing that impact disproportionately on many groups protected by the Equality Act 2010. I hope the Mayor and the government read this report and follow the recommendations. Inequality, whatever form it takes, must be tackled and we must put in place proper policies that redress the significant inequalities in our city. Hopefully this report will contribute towards achieving this aim. Jennette Arnold OBE AM London Cost of Living Report | 1 CONTENTS CASE STUDY 3 KEY SURVEY STATISTICS 4 HARDEST HIT LONDONERS 5 BLACK, ASIAN AND MINORITY ETHNIC 6-9 PEOPLE WITH DISABILITIES 10-12 WOMEN 13-16 YOUNG LONDONERS 17-18 OLDER LONDONERS 19-20 LESBIAN, GAY, BISEXUAL AND TRANSGENDER 21-22 POLICY ANALYSIS 23-24 RECOMMENDATIONS 25-26 METHODOLOGY REFERENCES 27 28-31 London Cost of Living Report | 2 FALLING FURTHER BEHIND: The impact of high living costs on vulnerable groups As a disabled pensioner my gas bills rose from £287 last quarter to £419 this quarter, even though we have not had freezing weather or snow. The heating allowance has reduced to £200 per annum and I am no longer eligible for free insulation. People now have to choose between heating or eating. There is no equality in food and fuel poverty. How can London be such a rich city and yet be so unaffordable for Londoners? How can we continue to live in a situation where we are forced to choose between basic necessities such as warmth and food? Pensioner, Bexley London Cost of Living Report | 3 FALLING FURTHER BEHIND: The impact of high living costs on vulnerable groups Black, Asian and Minority Ethnic Londoners are the hardest hit by rising living costs. Hardest hit Londoners by the cost of living crisis BAME 30% 25% Parents Low income workers People who rent People with disabilities 26% 24% 23% 20% 14% 15% 10% 14% 13% 6% 6% 6% White Londoners BAME White males BAME males Londoners White females 5% 0% Young people Young men Young women Unemployment rates in London BAME females Source: ONS Annual Survey of Hours and Earnings and London Cost of Living Survey 86% of young people (16-30) think that public transport fares are too high in the capital. Two-thirds of BAME Londoners believe their living standards have declined in recent years and will continue to do so. More than half of women in London have seen their living standards fall in recent years. 9 out of 10 disabled Londoners are concerned about the rising cost of gas and electricity bills. London Cost of Living Report | 4 FALLING FURTHER BEHIND: The impact of high living costs on vulnerable groups The rising cost of living in London has impacted on Londoners across the city. The results from the London Cost of Living Survey have shown that 85% of Londoners are concerned about rising energy bills, 84% think public transport is too expensive, and 94% believe that the minimum wage is insufficient to live on in Londo n.i However, there are certain groups within London’s demography that have been hit particularly hard by spiralling costs. The survey results show that in London, people from Black, Asian, and Minority Ethnic backgrounds have been hit the worst by the cost of living crisis. 10 hardest hit groups by the cost of living crisisii 1. People from Black, Asian and Minority Ethnic (BAME) backgrounds. 2. 40 to 49 year olds. 3. Parents. 4. Low income workers. 5. People who rent their home. 6. People with disabilities. 7. 50 to 59 year olds. 8. 30 to 39 year olds. 9. Housing benefit claimants. 10. Inner Londoners. It is likely that the respondents aged 30 to 59 are amongst the hardest hit because there is a higher proportion of parents in these age groups; in particular those with young children. This is supported by fertility statistics released by the Greater London Authority which shows that the mean childbearing age in Greater London is 31. iii 10 HARDEST HIT GROUPS BY THE COST OF LIVING CRISIS HARDEST HIT LONDONERS Black, Asian and Minority Ethnic 40 to 49 year olds Parents Low income workers People who rent People with disabilities 50 to 59 year olds 30 to 39 year olds Housing benefit claimants Inner Londoners London Cost of Living Report | 5 FALLING FURTHER BEHIND: The impact of high living costs on vulnerable groups BLACK, ASIAN AND MINORITY ETHNIC (BAME) SURVEY FINDINGS: London Cost of Living Survey results for BAME respondents. REVIEW OF EXISTING INTELLIGENCE: Research conducted by Trust for London and the New Policy Institute found that the proportions of those living in poverty vary significantly between ethnic groups. Compared to London’s White population, the proportion of people in poverty is twice as hig h among Black Africans and even higher among Bangladeshis and Pakistanis. iv Food poverty People from BAME backgrounds appear to be disproportionately impacted by higher food costs than their White counterparts. Almost three-quarters (72%) of BAME respondents in the Cost of Living Survey said they are worried by rising food prices and a similar proportion (74%) said they are in favour of universal free school meals in primary schools. v London Cost of Living Report | 6 FALLING FURTHER BEHIND: The impact of high living costs on vulnerable groups A study v i by the Joseph Rowntree Foundation found that poor diet and the inability to afford healthy food like fresh fruit and vegetables on a regular basis was a problem amongst BAME Londoners. The study also cites research by the Food Standards Agency which found that the poorest households are unable to afford balanced meals. v ii “I would love to be able to afford fresh fish, I know it is good for me and my family, but how can I afford that on a regular basis with so many mouths to feed and very little income? The problem is that most of the good food they tell you to eat is so expensive.” Somali male, 42 years old, Haringey vii Public transport BAME respondents were significantly more concerned about the rising cost of public transport in the capital compared with White respondents with 73% of BAME respondents saying they are worried compared with 58% of White respondents. v iii 92% of BAME respondents said that public transport is too expensive. ix Researchx conducted by Transport for London (TfL) found that the bus is the most common mode of public transport amongst ethnic minorities, particularly those of Black ethnicity. They also found that 69% of BAME Londoners use the bus at least once a week compared to 56% of White Londoners. London Assembly Member Val Shawcross’ report ‘Fair Fares: Tackling high public transport fares in London’ found that in the last five years under the current Mayor, bus fares have risen by 43.8% and up to an extra £278 has been added to the annual cost of bus fares for 28% of low income Londoners. x i x ii “The cost of public transport is a particular barrier to increased public transport use amongst BAME Londoners. 60% of BAME Londoners say cost is a barrier compared to 38% of White Londoners.” Transport for Londonx ii TfL’s research also shows that of the Londoners who have used Barclays Cycle Hire scheme, 88% are white.x iii Childcare 28% of BAME respondents in the London Cost of Living Survey said they are concerned about the rising cost of childcare. This is 13 percentage points higher than the proportion of White respondents concerned. x iv London Cost of Living Report | 7 FALLING FURTHER BEHIND: The impact of high living costs on vulnerable groups Research from the Department for Education x v shows that the use of childcare varies significantly by ethnic group. Their statistics show that almost three quarters (72%) of White British parents use childcare compared with less than half for many BAME groups such as Black African (47%), Asian Pakistani (45%) and Asian Bangladeshi (37%). The Daycare Trust found that some BAME mothers wanted childcare to attend English classes and other training or studies in order to improve their opportunities and secure employment in the long term. However, they found that, in addition to childcare provision being expensive in London, the structure of childcare services do not always meet the needs of BAME families as many would require provision outside of typical working hours and part-time. London Assembly Member Onkar Sahota’s reportx v i ‘Childcare: Looking after London’s economy’ outlines how lack of access to affordable childcare acts as a barrier to employment and highlights Section 6 of the Childcare Act 2006 which requires local authorities to ensure there is childcare available to enable parents to take up or remain in work or to undertake education of training to assist them in obtaining work. Official Government guidance x v ii recognises that ‘families from Black and Minority Ethnic communities may have particular needs in terms of venues, languages, cultural appropriateness and faith’ and states that ‘based on the cultural and linguistic needs of these groups, local authorities should actively consider ways in which they can enable the development of appropriate and inclusive services which ensure minority ethnic families can access childcare locally that meets their needs’. Housing The results from the London Cost of Living Survey show that over half (55%) of BAME respondents are concerned about the rising housing costs in the capital. 42% of BAME respondents said they spend 50% or more of their take home pay on housing compared to 21% of White respondents. x v iii Research by GLA Intelligence x ix shows that the proportion of Black Londoners who use private rented housing is 22.1% which is a significant increase when compared with 1991 when this figure was 9.2%. There is a similar picture for Asian Londoners with 30.4% in private rented housing. In 1991, this figure was 7.9%. Many BAME Londoners appear to be overrepresented in the social rented sector with 47.6% of Black Londoners and 48.5% of Bangladeshi Londoners in social rented housing. Social housing is let at low rents on a secure basis to those who are most in need or struggling with their housing costs. These are usually provided by councils and not-for-profit organisations such as housing associations. x x Energy bills BAME Londoners appear to be hit harder by higher energy bills compared with their White counterparts. Three-quarters of BAME respondents to the London Cost of Living Survey have sacrificed heating their homes in order to afford their bills. More than half of BAME Londoners have cut back on lighting and electrical equipment use compared to a third of white Londoners. x x i London Cost of Living Report | 8 FALLING FURTHER BEHIND: The impact of high living costs on vulnerable groups Living standards and pay A higher proportion of Londoners from BAME backgrounds have experienced declining living standards compared to those from White backgrounds. In the survey, 65% of BAME respondents said that their living standards have declined in the past three years. This is 8 percentage points higher than the proportion of white respondents. When asked about the next three years, the proportions were similar with 62% of BAME respondents and 61% of White respondents believing their living standards will decline.x x ii The 2011 Census shows that 40% of Londoners are from BAME backgrounds x x iii and research has shown that half of all people in poverty in London are from BAME backgrounds. x x iv The work that Archibishop of York, John Sentamu, Chair of the Living Wage Commission is doing is an important step to tackle poverty pay across all groups including BAME.x x v Proportion of employees paid below the London Living Wage x x v i London Cost of Living Report | 9 FALLING FURTHER BEHIND: The impact of high living costs on vulnerable groups PEOPLE WITH DISABILITIES SURVEY FINDINGS: London Cost of Living Survey results for respondents with disabilities. REVIEW OF EXISTING INTELLIGENCE: London’s Poverty Profile shows that in London, as elsewhere in England, disabled people are more than twice as likely to lack work as those who are not disabled. This problem is particularly prevalent in Inner London within which disabled people are the less likely to be in work than in the rest of the country.x x v ii Food poverty 77% of disabled Londoners in the Cost of Living Survey said they are concerned about the rising cost of food. This is 18% higher than the proportion of non-disabled Londoners that are concerned. 70% of disabled respondents said they support free school meals. Research by the Disability Benefits Consortium (DBC), which is made up of fifty charities and other organisations such as the MS Society and RNIB, has found that food banks have ‘become a lifeline for disabled people’ due to the changes to the benefits system. x x v iii The DBC’s survey of nearly 4,000 London Cost of Living Report | 10 FALLING FURTHER BEHIND: The impact of high living costs on vulnerable groups disabled people found that more than one in ten (12%) of those hit by housing benefit chang es have had to use food banks in order to feed themselves and their families. Public transport The Cost of Living Survey found that more than half of disabled respondents are concerned about the rising cost of public transport in London. 86% of disabled respondents said they think that fares are too high.x x ix At a disabilities roundtable at City Hall in January 2014x x x , a number of concerns were raised about accessibility on public transport. An example was given by a stakeholder that a vast amount of transport was out of bounds and that a campaign had been organised regarding Crossrail not being fully accessible. It was largely agreed that disabled and older people should be given a greater option to choose their mode of travel, especially as it affects them in terms of employment opportunities. Concerns were also raised about the accessibility of the new TfL buses as the design appears to be lacking in space for wheelchair users to move around. Disabled and older people campaign group, Transport for All have previously expressed their frustration at the smaller wheelchair space on the New Bus for London to the London Assembly Transport Committee. x x x i Childcare The gaps in provision of specialised childcare for children with disabilities cause particular problems for parents across London. A reportx x x ii by the Daycare Trust found that parents with disabled children felt that the gaps in specialised childcare provision represent considerable barriers to the take up of childcare. Other gaps in provision were: Settings where they could place both their disabled and non-disabled children. Provision for their own emotional wellbeing as parents of disabled children. Care for children of asylum seekers. Childcare workers who are also parents of disabled children. Appropriate settings for their disabled children as they got older. Transitional care from child to adult services. Regarding the cost of childcare x x x iii for disabled children, the Daycare Trust found that: Among parents who do not use childcare for their disabled children, cost is often a factor. Knowledge and take up of the financial allowances available to parents of disabled children such as Working Tax Credits and childcare vouchers from employers is quite low. Many parents feel that as full time residential care for disabled children would be expensive for the Government compared with other formal childcare arrangements such as holiday clubs, they should be provided with extra support to access the latter. The extra costs associated with childcare provision for disabled children fall on the providers meaning that the number of suitable options for parents is reduced. London Cost of Living Report | 11 FALLING FURTHER BEHIND: The impact of high living costs on vulnerable groups Some parents feel that specialised childcare provision should be free as it is necessary for disabled children to become integrated into society. The cost of childcare during school holidays is unaffordable for many parents of disabled children. Housing 62% of people with disabilities said that they are concerned about the rising cost of housing; 12 percentage points higher than the average for all respondents. x x x iv 29% of disabled respondents said they spend 50% or more of their income on housing costs; 6 percentage points higher than the average. x x x v According to the Draft Further Alterations to the London Plan, 10% of new housing in London is designed to be wheelchair accessible or easily adaptable for residents who are wheelchair users. x x x v i Energy bills 91% of disabled Londoners said they are concerned about the rising cost of gas and electricity bills. This is 10 percentage points higher than the proportion of non-disabled Londoners that are concerned. A significantly higher proportion of disabled Londoners have also cut back on heating (74%), lighting (42%) and electrical equipment use (49%). x x x v ii “I am a 55 year old, disabled, single person, and I have many health problems and permanent illness. I do not have any ability to work. My income is now of very low worth and is just enough for bills. It does not meet other needs.” Survey respondent, Barnet Living standards and pay The London Cost of Living Survey shows that disabled Londoners are the hardest hit group with regards to declining living standards. 71% of disabled respondents believe that their living standards have gone down in the past three years. This is 15 percentage points hig her than the average across London and 14 percentage points higher than the figure for non-disabled respondents. 74% of disabled respondents believe that their living standards will continue to go down in the next three years. x x x v iii In London, people with disabilities are over twice as likely to be without work as people who are not disabled and have been disproportionately affected by welfare changes. x x x ix It is likely that this has contributed to declining living standards. London Cost of Living Report | 12 FALLING FURTHER BEHIND: The impact of high living costs on vulnerable groups WOMEN SURVEY FINDINGS: REVIEW OF EXISTING INTELLIGENCE: London Cost of Living Survey results for female respondents. Research carried out by the Fawcett Society has found that the current austerity agenda has left women facing what it calls a ‘triple jeopardy’ of cuts to jobs, benefits and vital services. Their research shows that around three quarters of the money being cut from benefits and tax credits is coming from the pockets of women. x l London’s Poverty Profile shows that women are particularly vulnerable to poverty due in part to the gender pay gap and the costs associated with caring for children. It found that women, especially BAME women, working full time are paid less per hour than men doing work of equivalent value. x li Food poverty Almost three-quarters of female respondents (71%) to the Cost of Living Survey, said they are concerned about rising food costs in London; 12 percentage points higher than the proportion of their London Cost of Living Report | 13 FALLING FURTHER BEHIND: The impact of high living costs on vulnerable groups male counterparts. x lii More than half of women in London (51%) support the introduction of free school meals for all primary school children. x liii Public transport The survey found that more than half of female respondents (54%) are concerned about the rising cost of public transport in the capital. Almost three-quarters (71%) said that transport fares are too high. x liv A poll carried out in March 2012 for the End Violence Against Women Coalition, found that more than a quarter of women feel unsafe on London’s transport network and that women were increasingly concerned about staffing levels in stations and a lack of visible policing on the capital’s network. x lv These concerns are outlined in Val Shawcross’ ‘Fair Fares’ report and states that in order for price to match quality on London’s transport, stations need to be safe and secure. x lv i Childcare The results from the survey show that 15% of female respondents are worried about the rising cost of childcare in London with an even higher proportion of parents (39%) concerned. x lv ii London currently has the lowest rate of parental employment of any region in the UK. x lv iii It also has the lowest rate of maternal employment. x lix According to figures from the Office for National Statistics, London has the lowest rate of female employment in the UK. l A recent survey carried out by MumsNet and the Resolution Foundation found that two thirds of mothers say the cost of childcare is an obstacle to them working more. Their research also analyses OECD data which shows that the UK is significantly behind on rates of maternal employment than some other Western economies. In the UK, 67% of mothers are in some form of paid work compared to 86% for Slovenia, and behind other countries such as Iceland, Sweden, Denmark, the Netherlands, and Finland. li Research conducted by the Institute for Public Policy Research lii found that supporting mothers into fulltime employment would generate a net positive fiscal impact of approximately £700 million annually. This is due to a combination of increased tax revenue and savings from out-of-work benefits. It also found that it would have a significant impact on living standards for higher-income families. Lowincome families, it says, are less likely to have a mother even in part-time work. Housing Almost half of female respondents (49%) to the Cost of Living Survey said that they are concerned with rising housing costs in the capital. 22% of female resp ondents they said that spend 50% or more of their take home pay on housing costs. liii Out of the 2,366 survey respondents, a similar proportion of men (31%) and women (29%) said they rent their home, however less than half of women (46%) said they own their home compared to 53% of male respondents. liv London Cost of Living Report | 14 FALLING FURTHER BEHIND: The impact of high living costs on vulnerable groups Energy bills The overwhelming majority (87%) of female respondents to the Cost of Living Survey said that they are concerned with the rising cost of gas and electricity bills in London. Almost two -thirds (61%) of women said that they have cut back on heating their homes in the face of rising energy bills. 35% of women said they have cut back on lighting and electrical equipment use in their home. lv Living standards and pay Over half of female respondents to the survey (56%) said they believe their living standards have gone down in the past three years. 1 in 2 female respondents said their living standards will go down in the next three years. lv i Research from the Fawcett Society lv ii shows that across the UK, women earn 85p for every pound a man earns and that women make up the majority of those in low paid jobs. They also found that women also experience economic inequality later on in life with women’s average personal pensions being only 62% of the average for men. Economic activity by men/women in London Figures from Annual Population Survey for Oct 2012 – Sept 2013 London Cost of Living Report | 15 FALLING FURTHER BEHIND: The impact of high living costs on vulnerable groups The Institute for Public Policy Research found that 64% of low paid workers are women. lv iii Other research by the Trade Union Congress (TUC) reveals that there is still a huge pay gap between the salaries of men and women and that of the 35 majo r occupations as classified by the Office for National Statistics, women earn less than men in 32 of these professions. lix The TUC also found that women earn 35% less per hour than men who work in full time and that women who do work full time earn nearly £5,000 less than men every year. lx Zero-hours’ contracts While zero-hours’ contracts are believed to impact on many groups, including BAME people, research from the Work Foundationlx i has found that those on zero-hours’ contracts are more likely to be women estimating that 56% of zero-hours’ workers are women. It also found that zero-hours as a share of the workforces are common in industries such as the arts, entertainment and recreation services as well in food and accommodation services and in healthcare. Data from the Office for National Statistics shows that 250,000 workers in the UK are on zero-hours’ contracts, representing approximately 1% of the UK workforce lx ii; however this figure is in disputed. The Chartered Institute of Personnel and Development (CIPD) estimate that the real number is more than one million. lx iii Research by the CIPD found that 16% of zero-hours’ workers said their employer often fails to provide them with sufficient hours each week. lx iv The CIPD also warn that employers may take advantage of zero-hours’ contracts by using them as a management tool – offering more hours to employees that ‘behave’ and fewer to those who cause trouble; allowing for the possibility of exploitation. lx v The government launched a consultation on 19 December 2013 which outlines proposals on ways to tackle the lack of transparency in the way zero hours contracts are currently being used and improve guidance for both employers and employees around their use. lx v i This consultation closed on 13 March 2014. Following, this consultation GMB called on government to broaden the scope of its consultation to take into consideration other workers who are also being abused and are being employed on hours below the perceived norm for part time workers. lx v ii A reportlx v iii by the London Assembly’s Economy Committee found that employers in London who do use zero-hours’ contracts put more of their workforce on zero-hours’ contracts than comparable employers in the rest of the country. Across the UK, the percentage of employees on zero-hours’ contracts for organisations that use them is 16.5%. In London, it is significantly higher at 27.8%. It’s important to note that zero-hours may suit some people who are seeking for occasional earnings and have the option to be flexible about when they work. London Cost of Living Report | 16 FALLING FURTHER BEHIND: The impact of high living costs on vulnerable groups YOUNG LONDONERS SURVEY FINDINGS: London Cost of Living Survey results for young people (aged 16-30) REVIEW OF EXISTING INTELLIGENCE: London’s Poverty Profile shows that the young adult unemployment rate in London is at its highest level since 1993. It also shows that 1 in 4 economically active young adults in London is unemployed, compared to the average of 1 in 10 for all working -age adults. lx ix The London Cost of Living Survey results show that housing and transport costs are a particular concern for young people whilst older people appear to be concerned about food and energy bills. Food poverty Half of younger respondents (aged 16-30) said they are concerned with rising food costs and almost three-quarters of them (70%) said they support free school meals. lx x London Assembly Member, Fiona Twycross’ report ‘Free School Meals: Taking children out of food poverty’ argued the case for the introduction of universal free school meals. Her report outlined the following arguments for free school meals: A hungry child is less able to concentrate in the classroom. Hungry children are more disruptive and negatively impact all children’s education. Only 1 in 10 packed lunches are as nutritious as free school meals. Free school meals save parents around £500 a year. Children eating together has a positive impact in fostering better social skills. Evidence from Newham shows that the benefits from free school meals have been educational attainment and child development. Universal free school meals can end the stigma surrounding children who receive free school meals. London Cost of Living Report | 17 FALLING FURTHER BEHIND: The impact of high living costs on vulnerable groups Public transport The Cost of Living Survey results show that 72% of respondents aged 16-30 are concerned about rising public transport costs in the capital.lx x i Campaign organisation Better Transport found that public transport, particularly buses has been one of the top concerns for young people for some time now. A campaign to ‘make public transport cheaper, better and accessible for all’ was the UK Youth Parliament’s priority campaign in 2011/12. lx x ii Housing 75% of respondents aged 16-30 said they are concerned about the rising housing costs in London. A third of young people said they spend over half of their take home pay on these costs. A further 54% spend between a quarter and a half of their income. lx x iii Data from the Land Registry lx x iv shows that the average cost for a flat in London is £367,828. This is a 24% increase up from £295,820 in 2010. The average cost across England and Wales is £160,152 up from £152,769 in 2010 which is a 5% increase. Halifax’s ‘Generation Rent: A society divided?’ reportlx x v found that over half of the respondents in their research believe that Britain will become a ‘nation of renters’ in the next generation and that a fifth of non-homeowners aged 20-45 have already given up on the prospect of owning a property. Living standards and pay The current Government removed the Education Maintenance Allowance (EMA) in England for young people aged 16 and 17 which had helped them cover the costs of staying on in education after GCSEs. During the time it was around, the EMA increased participation rates in post-16 education among young people who were eligible to receive it by 4% (for 16 year olds) and 7% (for 17 year olds). lx x v i In their report, the Institute for Fiscal Studies (IFS) concluded that the costs of providing EMA were likely to be exceeded in the long term by the higher wages that its recipients would go on to enjoy in the future. A report commissioned by the Department for Children, Schools and Families, independently carried out by the Universities of York and Birmingham lx x v ii, showed that the EMA was a significant factor in more students from Black African and Black Caribbean families staying in educ ation past the age of 16. The Institute of Education also confirmed this in their report. lx x v iii A report by the IFS concluded that the EMA helped improve Asian females’ performance in post-16 education by 4.3%; black females’ by between 5.2-6.2%; and black males’ by 27%. lx x ix London’s Poverty Profile shows that in 2012, 25% of economically active young adults in London were unemployed, five percentage points higher compared to the rest of England. In addition to this, they found that in the last year, the young adult unemployment rate in the rest of England did not change, whilst in London it increased. lx x x “As a young person who has recently moved to London for work, being paid a living wage has ensured that I can just about afford to pay for rent, transport and food. I cannot imagine how people, especially those with dependents, are expected to live and work in London on the national minimum wage.” London Living Wage employee, Waltham Forest London Cost of Living Report | 18 FALLING FURTHER BEHIND: The impact of high living costs on vulnerable groups OLDER LONDONERS SURVEY FINDINGS REVIEW OF EXISTING INTELLIGENCE: London Cost of Living Survey results for older people (aged 60 and above) The London Cost of Living Survey results show that older people ap pear to be concerned about food and energy bills. Food poverty Almost two-thirds of respondents over 60 said they are concerned about the rising cost of food in the capital. A survey by the London Assembly Health and Environment Committee of older people ’s organisations found that 64% of older people organisations said that older people had found it harder to afford enough healthy food and that 58% of organisations stated that older people regularly struggled to buy affordable healthy food in local shops. lx x x i The ‘Zero City Hunger’ reportlx x x ii states that malnutrition levels among older people are an indicator of food poverty and that it is estimated that, nationally, malnutrition affects over 10% of older people aged 65 and over which represents an estimated 90,000 older people in Greater London. It also found that over half of the costs of addressing malnutrition are spent on people in this age group and that an estimated 25% of older people aged 65 and over admitted to hospital in the UK and Republic of Ireland were found to be at risk of malnutrition. Public transport The Cost of Living Survey results show that 32% of respondents aged 60 and over. Londoners aged 60 and over are eligible for free travel across London with the Freedom Pass. 80% of those age d over 60 said public transport fares are too. lx x x iii Housing The housing crisis is also impacting older Londoners. 40% of respondents over 60 recognise the rising cost of housing with 15% spending over half their income to pay for it. lx x x iv London Cost of Living Report | 19 FALLING FURTHER BEHIND: The impact of high living costs on vulnerable groups With regards to residential care, London has the highest average costs in the UK of £31,096 a year. The average cost for care homes with nursing in London is £42,692 a year. In the North West, the average annual care home bill is £24,336 and with nursing it is £34,476.lx x x v Energy bills Older people are particularly affected by the rise in energy bills as 95% of respondents in the survey aged 65 or older said that they are worried about rising energy bills. The elder generation are the most vulnerable in the face of increased energy bills. This is most likely due to the high demand for energy in the elder population due to the dangers of living in a cold home. Despite these risks, 63% of those aged 65 or older said they have cut back on heating as a direct result of the unaffordable energy bills.lx x x v i Whilst the profit margins for the ‘Big Six’ energy companies are soaring lx x x v ii, London’s elder generation are plunging into a cold homes crisis with almost two-thirds risking their health to pay the bills. “I am old (77); I am worried sick about what our heating costs will be this coming winter. I have bought two fleece blankets and two hot water bottles, for my 73 year old husband, who is on a kidney disease register and myself in advance of winter. In our case it has to be eat, not heat, hence the blankets and bottles. Life at our age is becoming frightening.” Pensioner, Hounslow Living standards and pay Two-thirds of older respondents to the survey said they believe that their living standards will fall in the next three years. Over half of these respondents said that their living standards had already declined in the past three years. lx x x v iii Figures from the Office for National Statistics suggest that Londoners aged 65 and over may be having to work longer than people in other parts of the UK. The employment rate for those aged 65 and over in London is 11%. This is compared to 6% in the North East, 7.6% in the North West, and 9.6% in the West Midlands. It is also higher than the employment rates for Northern Ireland (8.9%), Scotland (8%) and Wales (9%). The employment rate for male Londoners in this age range is 14.4% and for women it is 8.2%.lx x x ix The state pension age for men and women born before 1955 is 65 years old. x c Source: Annual Population Survey London Cost of Living Report | 20 FALLING FURTHER BEHIND: The impact of high living costs on vulnerable groups LESBIAN, GAY, BISEXUAL, AND TRANSGENDER (LGBT) SURVEY FINDINGS: REVIEW OF EXISTING INTELLIGENCE: London Cost of Living Survey results for Lesbian, Gay and Bisexual respondents. Housing Research conducted by Shelterx ci has found that Lesbian, Gay, Bisexual and Transgender (LGBT) people are vulnerable to discrimination in the housing sector – for example, in some cases, two men can be refused a hostel room with a double bed, although one is available, because the hostel says it is against their policy to allow adults of the same sex to share a bed, even though the law does not permit discrimination along the lines of sexuality. Data from the Albert Kennedy Trustx cii (an organisation that supports young LGBT people who are made homeless or live in hostile environments) shows that the Trust receives over 2,000 calls for support every year from London, Manchester and Newcastle; 1 in 4 homeless youths may identify as LGB or T; 85% of LGBT young people have faced rejection by their parents after coming out; and that London Cost of Living Report | 21 FALLING FURTHER BEHIND: The impact of high living costs on vulnerable groups over two-thirds of young men supported by the Trust had been offered sex or had been forced to offer sex to get a bed for the night. They also found that many LGBT young people will not use mainstream provision for fear of homophobia or transphobia from other service users or the service itself. Employment Stonewall’s ‘Serves You Right’ survey x ciii of 1,658 lesbian, gay and bisexual people showed that nearly 1 in 5 gay people say they have experienced bullying from their colleagues due to their sexual orientation. Stonewall has found that discrimination in the workplace can lead to people leaving their jobs and becoming unemployed. They also found that LGB people in occupational groups C2DE (working class) are 50% more likely to experience bullying than those in occupational groups ABC1 (middle class). Stonewall also surveyed 1,140 young LGB peoplex civ and found that 65% had experienced homophobic bullying which 7 out of 10 have said has impacted on their work. Half of the respondents said they have skipped school at some point because of it. Stonewall point out that sexual orientation discrimination can impact on mental health and well-being with many developing mental health problems such as anxiety and depression. x cv London Cost of Living Report | 22 FALLING FURTHER BEHIND: The impact of high living costs on vulnerable groups POLICY ANALYSIS ‘Cornflake economics’ “The harder you shake the pack, the easier it will be for some cornflakes to get to the top. And for one reason or another – boardroom greed or, as I am assured, the natural and God-given talent of boardroom inhabitants – the income gap between the top cornflakes and the bottom cornflakes is getting wider than ever. I stress: I don’t believe that economic equality is possible; indeed, some measure of inequality is essential for the spirit of envy.” x cvi London Mayor Boris Johnson on inequality Despite the reams of evidence that there is structural inequality across the capital, it is shameful that the Mayor publicly encourages inequality in society and recommends further hardship for vulnerable sections of society as a cure as he stated in his Margaret Thatcher speech last year.x cv i It is clear from the evidence that many Londoners from Black, Asian and Minority Ethnic backgrounds face barriers to success due to low pay; employment discrimination; food poverty; lack of appropriate childcare provision; high public transport fares; and high rents. A report by the Runnymede Trust for the All Party Parliamentary Group on Race and Community in 2012 found that 25% of the unemployment rate for Black and Asian men and women is because of prejudice. They also found that BAME women face discrimination ‘at every stage of the recruitment process’. x cv ii Londoners with disabilities face barriers due to a smaller supply of suitable, accessible housing; cuts to disability allowances; food poverty; inaccessible public transport; lack of specialised childcare provision; and barriers to employment. This in turn, has forced many to turn to food banks and to risk their health by cutting back on heating so that they can afford the bills. Women face various barriers due to a lack of affordable childcare; low pay and low pensions; insecure employment contracts; public transport safety concerns; and widespread sexual discrimination. In February 2014, the Mayor claimed women are not ‘anywhere near’ achieving equal employment opportunities in the labour market, but that his own pool of advisers, in which ‘almost half’ of the staff are women, was an example of how things could be done. However, it turns out that only 4 of his 14 paid advisers are actually women (28%). Furthermore, within the Greater London Authority (GLA), women are overwhelmingly employed on lower salaries than their male counterparts and few women reach the highest pay scales. Of the 38 GLA employees earning over £80,000 a year, 28 are men. So, in contrast to the Mayor’s comments, the GLA and his office actually reflect the wag e inequality in the wider economy. x cv iii The inequality story for young and older Londoners is also not due to ‘natural and God -given talent’. Children and young people are facing barriers to success due to hunger impacting on their education; being forced to pay out high rents for accomodation; the cancellation of the education maintenance allowance; eye-watering university tuition fees; and a lack of job opportunities. Meanwhile, elder Londoners are facing hardship due to high energy bills; malnutrition; and rising costs of everyday necessities. London Cost of Living Report | 23 FALLING FURTHER BEHIND: The impact of high living costs on vulnerable groups Those who are LGBT face societal discrimination which feeds into employment opportunities and even housing. Due to a high risk of domestic abuse, LGBT Londoners who are victims of abuse also struggle from a lack of emergency accomodation in the city. Studies have also shown that the vast majority of homelessness services work with people who identify as LGBT. Action can be taken on these issues and inequality is not inevitable. It is certainly not ‘essential’ as the Mayor suggests. The evidence shows that the barriers that vulnerable groups face are not ‘natural’ but are structural and the Mayor’s ‘cornflake economics’ of inequality as being a good thing for the economy is ludicrous, unhelpful, and useless. London Cost of Living Report | 24 FALLING FURTHER BEHIND: The impact of high living costs on vulnerable groups POLICY RECOMMENDATIONS Despite London having a diverse, multicultural and global population, there are clearly numerous barriers for women, people from BAME backgrounds, young people, those with disabilities and LGBT people to prosper in what is one the wealthiest cities in the world. It is unacceptable that Londoners from BAME backgrounds, particularly, are being failed in terms of fair pay, employment, childcare provision and housing. It is unacceptable that support for people with disabilities are being slashed, forcing them to be concerned about the cost of basic necessities like food and energy bills. It is unacceptable that London has the lowest rate of maternal employment in the UK and that women still earn lower wages and receive lower pensions than their male counterparts. It is unacceptable that young people are being robbed of fulfilling their potential and the hope of a secure future. The Mayor can act and in order to reverse the widening inequality gap, he should: Pilot an Equality Scorecard scheme at the Greater London Authority in order to collect and monitor data on inequalities across key areas, including employment, criminal justice, education, and health. This would follow a similar route taken by Croydon, Kingston, and Redbridge Councils in conjunction with the Runnymede Trust. Provide a 6-months’ Jobs Guarantee to all young Londoners aged 16-24 who have been unemployed for more than 12 months.x cix Working closely with appropriate employers, the jobs guarantee would provide participants with 21 hours’ employment per week at the London Living Wage. Based on the 5,295c 16-24 year old Londoners unemployed for over 12 months, this scheme would require an investment of £25.44 million to finance in 2014/15. ci There are numerous benefits of this scheme including: o Preventing another ‘lost generation’ of unemployed young people ; o Encouraging businesses to invest for growth by reducing labour costs ; o Generating up to £19.01 million for HM Treasury;cii o Generating up to £40.7 million for the London Regional Economy. ciii Pilot schemes that tackle high levels of unemployment amongst high-priority groups including young black males, people with disabilities, ex-offenders, and care leavers.civ Working with key third sector partners, these would draw on b est practice and deliver innovative new means of tackling this problem with schemes such as the Visionary Placements programme run by the Royal London Society for Blind People which has helped 50 young blind and visually impaired people into voluntary and paid positions. Reduce the burden of high public transport costs on low paid Londoners by introducing the following ticketing options:cv o One hour bus tickets; o Part time travelcards; o Early bird fares. Combat fuel poverty by establishing a Fuel Poverty Referral and Advice Service to be known as HEAT (Home Energy Advice Team).cv i The role of HEAT is further outlined in Murad Qureshi AM’s ‘Cold Homes’ report. Introduce universal free school meals for all primary school-age childrencv ii in the capital and pilot universal free school meals at a number of secondary schools across London. London Cost of Living Report | 25 FALLING FURTHER BEHIND: The impact of high living costs on vulnerable groups Help mothers back into work by launching an inquiry into childcare provision in London and expanding investment in breakfast and afterschool clubs. cv iii Drive forward housing supplycix by reorganising the work of the GLA Land and Housing Directorate into a new ‘arms-length’ body called Homes for London. Homes for London would provide a focal point for driving forward investment and housing delivery in London in the same way that Transport for London gives greater focus to improving transport infrastructure. Invest in additional staff at the GLA for one year responsible for significantly increasing the GLA’s engagement with businesses to encourage take up of the London Living Wage.cx Support London’s Credit Unionscx i by making available to them the GLA’s unique access to Transport for London’s advertising space. London Cost of Living Report | 26 METHODOLOGY The London Cost of Living Survey ran from September 24 th 2013 until January 6th 2014. Paper surveys were distributed across all constituencies in London and the survey was also available online. In total, 2,366 Londoners responded to the survey. 872 Londoners answered the paper versions and 1,494 answered the online version. The respondents were self-selected. The breakdown for the London Cost of Living Survey can be found at http://cityhalllabour.org/. The term ‘rent’ in the survey refers to both social and private rent. A disabilities roundtable discussion was held at City Hall on Monday 13 January 2014. This was hosted by Jennette Arnold OBE AM and was attended by the following people: Tracey Bignall – Race Equality Foundation Cllr Lorna Campbell– Lambeth Council Sioned Churchill – Trust for London Liz Cooke – Disability activist Will Holmes – Alzheimer’s Society Tracey Lazard – Inclusion London Barbara Lowe – Disability activist Leo Mansell – Hackney Council Angela Mason – Disability activist Ron Newman – Disability activist Ann O’Neil – Brent Mencap Val Shawcross – London Assembly for Lambeth and Southwark Faryal Velmi – Transport for All Patrick Vernon – National Housing Federation Other sources of research can be found in the references. ACKNOWLEDGEMENTS I would like to thank the Labour Group Research Intern, Areeq Chowdhury for his work compiling this report. This is the final addition of the Cost of Living Reports and Areeq has been a valuable asset to the Labour Group compiling all the Cost of Living Reports. London Cost of Living Report | 27 REFERENCES i London Cost of Living Survey (24/09/13 – 06/01/14). London Cost of Living Survey (24/09/13 – 06/01/14). Hardest hit Londoners measured as a sum of scores per question measured as the London Cost of Living Survey Index (LCoLSI). Ten highest LCoLSI scores: BAME – 6.02; 40 to 49 year olds – 5.63; child benefit claimants – 5.62; working tax credit – 5.54; rents home – 5.51; disabled – 5.51; disabled – 5.51; 50 to 59 year olds – 5.42; 30 to 39 year olds – 5.07; housing benefit claimants – 5.01; inner Londoners – 4.97. iii ‘Fertility in London: 2001 and 2011’ - https://www.london.gov.uk/sites/default/files/Update%2002 -2014.pdf iv http://www.londonspovertyprofile.org.uk/indicators/to pics/ethnicity-low-income-and-work/ v London Cost of Living Survey (24/09/13 – 06/01/14) – 193 out of 269 BAME respondents said that they are concerned about the rising price of food in London. 200 out of 269 BAME respondents said they support free healthy school meals for all primary school children. vi ‘Experience of poverty and ethnicity in London’ - http://www.jrf.org.uk/sites/files/jrf/London-povertyethnicity-full.pdf vii Ibid. viii Ibid. 196 out of 269 BAME respondents said that they are concerned about transport fares compared to 634 out of 1,086 white respondents. ix Ibid. 247 out of 269 BAME respondents said that public transport fares are too high. x ‘Black, Asian and Minority Ethnic people’ - http://www.tfl.gov.uk/assets/downloads/customer-research/BAMEsummary.pdf xi ‘London Cost of Living Report: Fair Fares’ Val Shawcross, 2014 - http://valshawcross.com/val/wpcontent/uploads/2014/01/140124-Fair_Fares_-_London_Cost_of_Living_Report.pdf xii ‘Black, Asian and Minority Ethnic people’ - http://www.tfl.gov.uk/assets/downloads/customerresearch/BAME-summary.pdf xiii Ibid. xiv London Cost of Living Survey (24/09/13 – 06/01/14) – 74 out of 269 BAME respondents said that they are concerned about the rising cost of childcare in London. 159 out of 634 white respondents said they are concerned. xv Childcare and Early Years Survey of Parents, January 2013, p37 https://www.gov.uk/government/uploads/system/uploads/attachment_data/file/211820/SFR08 -2013Text9703_Updated_Jun13.pdf xvi ‘London Cost of Living Report: Childcare’ Dr Onkar Sahota, 2014. xvii ‘Securing sufficient childcare: Guidance for local authorities childcare act 2006’ Department for Children, Schools and Families p36 - http://dera.ioe.ac.uk/8148/1/DCSF-00600-2007.pdf xviii London Cost of Living Survey (24/09/13 – 06/01/14) – 149 out of 269 BAME respondents said that they are concerned with the rising cost of housing. 113 BAME respondents said they spend 50% or above of their take home pay on housing compared to 231 out of 1,086 White respondents. xix ‘Trends in Housing Tenure’ - http://data.london.gov.uk/datastorefiles/documents/20 11-census-trends-inhousing-tenure.pdf xx ‘What is social housing?’ http://england.shelter.org.uk/campaigns/why_we_campaign/Improving_ social_housing/what_is_social_housing xxi London Cost of Living Survey (24/09/13 – 06/01/14) – 204 out of 269 BAME respondents said they have cut back on heating; 143 have cut back on lighting; 130 have cut back on electrical equipment use. 705 out of 1,0 86 White respondents have cut back on heating; 364 have cut back on lighting; 374 have cut back on electrical equipment use. xxii London Cost of Living Survey (24/09/13 – 06/01/14). 175 out of 269 BAME respondents said they believe their living standards have gone down in the past three years. 619 out of 1,086 white respondents said theirs have gone down. 166 out of 269 BAME respondents said they believe their living standards will go down in the next three years. 664 out of 1,086 white respondents said theirs will go down. xxiii Ethnicity and National Identity in England and Wales 2011 http://www.ons.gov.uk/ons/dcp171776_290558.pdf xxiv ‘Ethnicity, low income and work’ - http://www.londonspovertyprofile.org.uk/indicators/topics/ethnicity -lowincome-and-work/ xxv http://livingwagecommission.org.uk/archbishop-of-york-launches-the-commission/ ii London Cost of Living Report | 28 REFERENCES xxvi Low pay by ethnicity - http://www.londonspovertyprofile.org.uk/indicators/topics/low-pay/low-pay-byethnicity/ xxvii http://www.londonspovertyprofile.org.uk/indicators/groups/disabled-people/ xxviii ‘Food banks become lifeline for disabled people as benefit changes hit’ MS Society, Dec 2013 http://www.mssociety.org.uk/ms-news/2013/12/food-banks-become-lifeline-disabled-people-benefit-changeshit xxix London Cost of Living Survey (24/09/13 – 06/01/14). 90 out of 164 disabled respondents said that they are concerned about the rising cost of public transport in London. 141 said that public transport fares are too high. xxx A roundtable discussion on disabilities was held at City Hall on Monday 13 January 2014. This was hosted by Jennette Arnold OBE AM. The full list of attendees can be found in the methodology section. xxxi Bus services in London. October 2013 http://www.london.gov.uk/sites/default/files/Bus%20Services%20in%20London%20Report%2C%20Transport% 20Committee_0.pdf xxxii Listening to parents of children with disabilities and special educational needs http://www.daycaretrust.org.uk/data/files/Research/lda_listening_to_parents_report.pdf xxxiii Ibid xxxiv London Cost of Living Survey (24/09/13 – 06/01/14). 101 out of 164 respondents with disabilities said that they are concerned about the rising price of housing in London. xxxv Ibid. 47 out of 164 respondents with disabilities said that they spend 50% or above on housing costs. xxxvi Draft Further Alterations to the London Plan, p98 - http://www.london.gov.uk/sites/default/files/FALP.pdf xxxvii London Cost of Living Survey (24/09/13 – 06/01/14). 149 out of 164 disabled respondents said that they are concerned about the rising price of gas and electricity in London. 984 out of 1,208 non -disabled respondents said they are concerned. 121 out of 164 disabled respondents said they have cut back on heating; 69 have cut back on lighting; 80 have cut back on electrical equipment use. 801 out of 1,208 of non -disabled respondents have cut back on heating; 455 have cut back on lighting; 438 have cut back on electrical equipment use. xxxviii London Cost of Living Survey (24/09/13 – 06/01/14). 117 out of 164 disabled respondents believe that their living standards have gone down in the past three years. 693 out of 1,208 non-disabled respondents said their living standards had gone down. 122 out of 164 disabled respondents said they believe that their living standards will go down in the next three years. 723 out of 1,208 non -disabled respondents said they believe their living standards will go down in the next three years. xxxix http://www.londonspovertyprofile.org.uk/test/indicators/groups/disabled -people/ xl ‘Cutting Women Out’ - http://uat.fawcettsociety.org.uk/cutting-women-out/ xli http://www.londonspovertyprofile.org.uk/indicators/groups/women/ xlii London Cost of Living Survey (24/09/13 – 06/01/14) – 923 out of 1,307 female respondents said that they are concerned about the rising price of food in London. 621 out of 1,051 male respondents said they are concerned. xliii Ibid. 662 out of 1,307 female respondents said they support free healthy school meals for all primary school children. 743 out of 1,051 male respondents said that they support it. xliv Ibid. 707 out of 1,307 female respondents said that they are concerned abou t the rising cost of transport in London. 933 said that transport fares are too high. xlv ‘One in four women feels unsafe using public transport in London’ http://www.standard.co.uk/news/london/one-in-four-women-feels-unsafe-using-public-transport-in-london7602939.html xlvi ‘London Cost of Living Report: Fair Fares’ Val Shawcross, 2014 - http://valshawcross.com/val/wpcontent/uploads/2014/01/140124-Fair_Fares_-_London_Cost_of_Living_Report.pdf xlvii London Cost of Living Survey (24/09/13 – 06/01/14). 195 out of 1,307 female respondents said that they are concerned about the rising cost of childcare in London. 98 out of 249 respondents that claim child benefit said they are concerned. xlviii Workless in London 2012, GLA Intelligence, October 2012, p8 xlix http://www.cpag.org.uk/content/missing-potential-why-european-funds-should-be-used-support-parentalemployment-london l London women are less likely to have a job than anywhere in UK, The Evening Standard, 26 September 2013 li ‘Cost of childcare is barrier to working more, says two-thirds of mothers’ http://www.theguardian.com/money/2014/jan/23/cost-childcare-barrier-work-mothers-survey lii Childmind the gap: Reforming childcare to support mothers into work http://www.ippr.org/images/media/files/publication/2014/02/childmind -the-gap_Feb2014_11899.pdf London Cost of Living Report | 29 REFERENCES liii London Cost of Living Survey (24/09/13 – 06/01/13) – 634 out of 1,307 female respondents said they are concerned about the rising cost of housing in London. 286 said they spend 50% or above of their take home pay on housing. liv Ibid. 328 out of 1,051 male respondents said they rent their home. 556 said they own their home. 381 out of 1,307 female respondents said they rent their home. 606 said they own their home. lv Ibid. 1,134 out of 1,307 female respondents said that they are concerned about the rising cost of gas and electricity bills in London. 791 said they have cut back on heating in the face of rising energy bills. 461 said they have cut back on lighting and 462 said they have cut back on electrical equipment use. lvi Ibid. 729 out of 1,307 female respondents said that they believe their living standards have gone down in the past three years. 660 said they believe their living standards will go down in the next three years. lvii http://uat.fawcettsociety.org.uk/cutting-women-out/ lviii IPPR, Working Out of Poverty: A study of the low paid and the working poor, 2008 lix TUC (7 November 2013), Women still earn £5,000 a year less than men, retrieved 08.11.2013 lx Ibid. lxi ‘Zero hours contracts and the flexible labour market’ - http://www.theworkfoundation.com/blog/872/Zerohours-contracts-and-the-flexible-labour-market lxii ‘What are zero hours contracts? - http://www.bbc.co.uk/news/business-23573442 lxiii Ibid. lxiv Ibid. lxv Ibid. lxvi https://www.gov.uk/government/news/ministers-to-consider-outlawing-exclusivity-on-zero-hours-contracts lxvii http://centrallobby.politicshome.com/members/member-press/member-press-details/newsarticle/zero-hourcontracts-are-only-part-of-the-problem-with-precarious-employment-and-irregular-work-patte/sites/gmb/ lxviii ‘Fair Pay: Making the London Living Wage the norm’ https://www.london.gov.uk/sites/default/files/Economy%20Committee%20Fair%20Pay%2011%20Feb%2014.p df lxix Young adult unemployment - http://www.londonspovertyprofile.org.uk/indicators/topics/work-andworklessness/young-adult-unemployment-over-time/ lxx London Cost of Living Survey. 118 out of 182 respondents aged 60 and above said they are concerned about rising food costs and 122 said they support free school meals. 115 out of 230 respondents aged 16 -30 said they are concerned about rising food costs and 162 support free school meals. lxxi London Cost of Living Survey. 165 out of 230 respondents aged 16-30 said they are concerned with the rising cost of public transport in London and 197 said fares are too high. 58 out of 182 respondents aged over 60 said they are concerned with rising public transport costs and 145 said fares are too high. lxxii http://www.bettertransport.org.uk/files/Young_People_and_Buses_FINAL_forweb_0.pdf lxxiii Ibid. 173 out of 230 respondents aged 16-30 said that they are concerned with the rising price of housing in London. 35 out of 230 respondents said they spend less than 25% of their take home pay on rent; 124 out of 230 spend between 25-50%; 69 out of 230 spend 50% or above. lxxiv http://www.landregistry.gov.uk/public/house-prices-and-sales/search-the-index lxxv http://www.lloydsbankinggroup.com/globalassets/documents/media/press releases/halifax/2013/1706_halifax_generation_report.pdf lxxvi IFS (September 2009), Conditional Cash Transfers and School Dropout Rates. Date retrieved: 22/08/2013 lxxvii Department of Children, Schools and Families (DCSF) (August 2008), Factors That Promote High Post-16 Participation of Many Minority Ethnic Groups, Date retrieved: 22/08/2013. lxxviii Institute of Education (September 2008). What are the factors that promote high post-16 participation of many minority ethnic groups? Date retrieved: 22/08/2013. lxxix IFS (November 2007), Education Maintenance Allowance: Evaluation with Administrative Data, Date retrieved: 22/08/2013. lxxx http://www.londonspovertyprofile.org.uk/indicators/topics/work-and-worklessness/young-adultunemployment-over-time/ lxxxi A Zero Hunger City: Tackling food poverty in London http://www.london.gov.uk/sites/default/files/A%20Zero%20Hunger%20City.doc.pdf lxxxii Ibid. London Cost of Living Report | 30 REFERENCES lxxxiii London Cost of Living Survey. 165 out of 230 respondents aged 16-30 said they are concerned with the rising cost of public transport in London and 197 said fares are too high. 58 out of 182 respondents aged over 60 said they are concerned with rising public transport costs and 145 said fares are too high. lxxxiv Ibid. 74 out of 182 respondents aged 60 or over said that they are concerned with the rising price of housing in London. 99 out of 182 respondents said that they spend less than 25% of their take home pay on rent; 47 spend between 25-50%; 27 spend 50% or above. lxxxv http://www.payingforcare.org/care-home-fees lxxxvi Ibid. 59 out of 94 respondents aged 65 or older said that they have cut back on heating in the face of rising energy bills. lxxxvii ‘Profits at the Big Six energy companies have rocketed since the financial crisis began’ http://www.telegraph.co.uk/news/politics/10472758/Profits-at-Big-Six-energy-companies-have-rocketedsince-the-financial-crisis-began.html lxxxviii London Cost of Living Survey. 120 out of 182 respondents aged 60 or above said they believe their living standards will go down in next three years. 95 said they believe their living standards had gone down in the past three years. lxxxix Office for National Statistics – Annual Population Survey for October 2012 – September 2013. xc https://www.gov.uk/calculate-state-pension xci http://england.shelter.org.uk/get_advice/finding_legal_advice/discrimination_in_housing xcii http://www.akt.org.uk/2/spg330/albert_kennedy_trust_ -_helping_young_lgbt_people/about_us.aspx xciii https://www.stonewall.org.uk/what_we_do/research_and_policy/2880.asp xciv Ibid. xcv Ibid. xcvi ‘Boris Johnson’s speech at the Margaret Thatcher speech in full’ http://www.telegraph.co.uk/news/politics/london-mayor-election/mayor-of-london/10480321/Boris-Johnsonsspeech-at-the-Margaret-Thatcher-lecture-in-full.html xcvii ‘Black and Minority Ethnic women discriminated against at every stage of recruitment process’ http://www.huffingtonpost.co.uk/2012/12/07/bme-women-runnymede-trustjobs_n_2256589.html?just_reloaded=1 xcviii http://www.london.gov.uk/mayor-assembly/mayor/mayoral-team xcix http://cityhalllabour.org/wp-content/uploads/2014/03/A-Living-Wage-London-Cost-of-Living-Report.pdf c Office for National Statistics, Londoners aged 24 and under, claiming JSA for over 12 months (December 2012). ci Total funding cost of 21 hours a week of work at the London Living Wage (currently £8.80 per hour) for each of the 5,295 long-term young unemployed for the entirety of the 26 week programme. cii £25.44 million comprises – 1) Reduced JSA count - a reduction in JSA of 5,295 (18-24 yr-olds in London in long-term unemployment)*£56.80 (under 24 JSA weekly rate) * 26 (number of weeks the scheme would operate); 2) Increased NI payments - £25.44 million(total gross pay to recipients) * 0.12 (the rate of National Insura nce paid by scheme participants – 12%); 3) VAT generated by expenditure in the broader economy resulting from the scheme - £40.7 million (expenditure resulting from scheme using an assumed fiscal multiplier of 1.6 (see footnote 15)) * 0.2(VAT at 20%). Please note: i) no income tax would be generated by the scheme as participants’ income would fall below the HMRC tax-free allowance of £10,000; ii) Discounting VAT from scheme-related consumption, the revenue generated for HMT by the scheme would be £5.08 million (25.44m * 0.2). ciii The net pay received by recipients of the scheme (£25.44 million)*1.6 (the estimated fiscal multiplier for a study of 27 countries during the 1930s (the episode that most closely characterises the liquidity trap currently faced by the U.K. Source – Blanchard, O., Leigh, D. (2013), Growth Forecast Errors and Fiscal Multipliers, International Monetary Fund Working Paper 13/1, p.4). civ http://cityhalllabour.org/wp-content/uploads/2014/03/A-Living-Wage-London-Cost-of-Living-Report.pdf cv http://cityhalllabour.org/wp-content/uploads/2014/03/Fair-Fares-London-Cost-of-Living-Report.pdf cvi http://cityhalllabour.org/wp-content/uploads/2014/03/Cost-of-Living-Cold-Homes.pdf cvii http://cityhalllabour.org/wp-content/uploads/2014/03/Free-School-Meals-London-Cost-of-Living-ReportFINAL.pdf cviii http://cityhalllabour.org/wp-content/uploads/2014/03/Childcare-London-Cost-of-Living-Report-1.pdf cix http://cityhalllabour.org/wp-content/uploads/2014/03/Fair-Housing-London-Cost-of-Living-Report.pdf cx http://cityhalllabour.org/wp-content/uploads/2014/03/A-Living-Wage-London-Cost-of-Living-Report.pdf cxi Ibid. London Cost of Living Report | 31 THIS PAGE IS INTENTIONALLY LEFT BLANK. London Cost of Living Report | 32 Enquiries: [email protected] 020 7983 4349 Media enquiries: 020 7983 4952 GREATERLONDONAUTHORITY | LONDONASSEMBLYLABOUR
© Copyright 2026 ExpyDoc