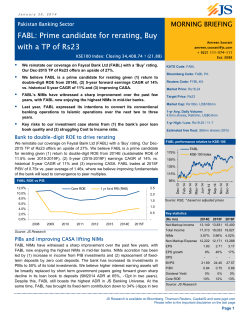
January 15, 2014 MORNING BRIEFING Pakistan Banking Sector BAHL: Rerating due on strong return generation – Buy with TP of Rs62 + 9221 111-574-111 KSE100 Index: Closing 33,585.75 ↑ (214.46) Target Price: Rs62 We forecast BAHL’s sustainable ROE at 22.7% (2015-19F) incorporating replacement of maturing PIBs with relatively lower yielding assets from 2017 onwards. Market Cap: Rs56bn, US$553bn We flag one of the highest PIBs investments (Rs126bn) by BAHL amongst mid-tier banks, where PIBs amount to 29% of its total deposits. Also, it’s PIB/Equity (4.34x) is the highest in JS Banking Universe. 1-yr High / Low: Rs50.52 / 34.63 Going forward (1) reversals in provisioned expenses and (2) gains realized from PIBs redemptions would be an addition to our base case future earnings growth. For further details, please refer to our detailed report released earlier. Investment case 1-yr Avg. Daily Volume: 0.6mn shares, Rs29mn, US$0.3mn Estimated free float: 667mn shares (60%) BAHL performance vs KSE-100 BAHL 140% KSE-100 130% We initiate our coverage on Bank Al-Habib Limited (BAHL) with a ‘Buy’ rating. Our December 2015 Target Price of Rs62 offers an upside of 24%, with a forward 12month D/Y of 11% (2015F: 6%). Our Target Price has been derived from the Justified P/B methodology, where the bank’s expected sustainable ROE is computed at 22.7%. BAHL trades at 2015F P/B of 1.58x vs. industry’s average of 1.83x. We believe these discounted valuations are unjustified given (1) low risk compared to peers and (2) higher than industry’s average earnings growth. Our 2015F earnings growth expectation for the bank stands at 18% YoY, driven by (1) improving NIMs and (2) lower infected books. We believe BAHL trades at a discount to its justified P/B offering attractive valuations against peers trading on a higher P/B. Muted asset risk BAHL has prudently maintained its ADR at around 40%, well below industry’s ADR of 53%. The bank’s balance sheet reflects preference of asset deployment in investments (IDR of 64% vs. industry’s IDR of 55%), with dominance of risk free government papers. We flag one of the highest PIBs investments (Rs126bn) by BAHL amongst mid-tier banks, where PIBs amount to 29% of its total deposits. Also, it’s PIB/Equity (4.34x) is the highest in JS Banking Universe. However with major portion of its investments in PIBs classified under Held-to-maturity, we do not expect any gains to be reflected in the bank’s equity or income statement. Soft Infection ratio with high coverage 120% 110% 100% 90% Source: KSE, * based on adjusted prices Key Valuations 2014E Net Markup Income 18,758 21,665 23,581 2015F 2016F NIMs 3.7% 3.9% 3.9% Non Markup Income 3,794 4,136 4,591 5.51 6.52 7.36 18.8% 18.4% 12.8% 2.50 3.00 3.50 BVPS 27.69 31.72 36.07 P/BV 1.81 1.58 1.39 EPS EPS growth DPS Dividend Yield Core ROE BAHL’s conservative approach has led to constant decline in its ADR over the years. The bank has replaced corporate lending with investments, with ADR Dec-14 Market Price: Rs50.07 Oct-14 Reuters Code: BKEQ.KA Aug-14 Bloomberg Code: BAHL PA Apr-14 Our Target Price has been derived from the Justified P/B methodology, where the bank’s expected sustainable ROE is computed at 22.7%. BAHL trades at 2015F P/B of 1.58x vs. industry’s average of 1.83x. KATS Code: BAHL Feb-14 We initiate our coverage on Bank Al-Habib Limited (BAHL) with a ‘Buy’ rating. Our December 2015 Target Price of Rs62 offers an upside of 24%, with a forward 12-month D/Y of 11% (2015F: 6%). Dec-13 Ext: 3099 Jun-14 Amreen Soorani [email protected] 5.0% 6.0% 7.0% 24.2% 24.6% 23.9% Source: JS Research JS Research is available on Bloomberg, Thomson Reuters, CapitalIQ and www.jsgcl.com Please refer to the important disclaimer on the last page Page 1 January 15, 2015 MORNING BRIEFING coming down to 39.6% as at September 2014 from 56% in December 2009. 40% of BAHL’s corporate loan book is directed towards the Textile sector, while 70% of its extremely low Infection ratio is fueled by the said. The bank has already covered its NPLs to the extent of taking its Coverage ratio to 150% as at Sep-14, where BAHL is yet to witness any reversals despite this aggressive provisioning strategy. We would like to highlight possibilities of reversals from the textile sector have improved given improving sector outlook on (1) increase in gas supply, (2) soft cotton prices and (3) declining interest rates. Any reversals would be an addition to our base case earnings. Also in Focus Pipeline construction for RLNG supply approved The Economic Co-ordination Committee (ECC) of the Cabinet has approved, in principle, the construction of a 1,100 km North South Gas Pipeline from Karachi to Lahore for supply of RLNG to the proposed gas fired power plants in Northern Pakistan. The ECC was informed that this project is critical for supply of RLNG to the proposed gas fired power plants in Northern Pakistan. Pakistan market statistics (Jan 14, 15) KSE-100 Index 33,585.75 Previous KSE-100 Index 33,371.29 Change from last closing 214.46 0.64% Change from last closing (%) 7,686.15 KSE Market Cap. (Rs. bn) KSE Market Cap. (US$ bn) 76.41 Total Volume (Shares mn) 383.56 17.75 Traded Value (Rs. bn) 176.44 Traded Value (US$ mn) 21,703.90 KSE-30 Index Change from last closing 116.76 Change from last closing (%) 0.54% KSE Futures Volume (Shares mn) 32.54 3,165.31 KSE Futures Value (Rs. mn) 11.77% KSE Futures Spread Source: KSE KSE valuations 2013A 2014A/E 2015F P/E (x) 11.0 9.3 8.6 P/BV (x) 2.2 2.0 1.9 Div. Yield (%) 4% 5% 5% 10% 18% 8% Earnings growth Source: JS Research JS Global Capital Limited 6th Floor, Faysal House, Shahrah-e-Faisal, Karachi Research: Equity Sales: Tel: +92 (21) 32799005 Tel: +92 (21) 32799513 Fax: +92 (21) 32800163 Fax: +92 (21) 32800166 [email protected] [email protected] This report has been prepared for information purposes by the Research Department of JS Global Capital Ltd. The information and data on which this report is based are obtained from sources which we believe to be reliable but we do not guarantee that it is accurate or complete. In particular, the report takes no account of the investment objectives, financial situation and particular needs of investors who should seek further professional advice or rely upon their own judgment and acumen before making any investment. This report should also not be considered as a reflection on the concerned company’s management and its performances or ability, or appreciation or criticism, as to the affairs or operations of such company or institution. Warning: This report may not be reproduced, distributed or published by any person for any purpose whatsoever. Action will be taken for unauthorized reproduction, distribution or publication. Page 2
© Copyright 2026 ExpyDoc