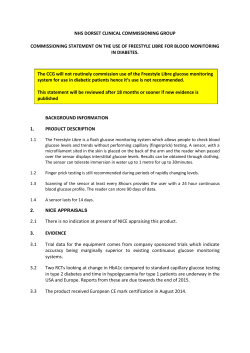
Cover Page
The handle http://hdl.handle.net/1887/25202 holds various files of this Leiden University
dissertation
Author: Pan, Qifang
Title: Metabolomic characteristics of Catharanthus roseus plants in time and space
Issue Date: 2014-04-16
13
Chapter 7
CLE to study metabolism in Catharanthus roseus
Chapter 7
13
C-isotope labeling experiments to study
metabolism in Catharanthus roseus
Qifang Pan1,2, Natali Rianika Mustafa 1, Robert Verpoorte 1, Young Hae
Choi 1
1
Natural Products Laboratory, Institute of Biology, Leiden University,
Sylviusweg 72, 2333 BE Leiden, The Netherlands
2
Plant Biotechnology Research Center, SJTU-Cornell Institute of
Sustainable Agriculture and Biotechnology, Fudan-SJTU-Nottingham Plant
Biotechnology R&D Center, School of Agriculture and Biology, Shanghai
Jiaotong University, Shanghai 200240, PR China
143
Chapter 7
13
CLE to study metabolism in Catharanthus roseus
Abstract
Plant metabolism is a complex network. Pathways are correlated and affect
each other. Secondary metabolic pathways in plant cells are regulated strictly,
and upon an intra- or extra stimuli (e.g. stress) the metabolic fluxes will change
as a response on the stimuli, e.g. to protect the plant against herbivore or against
microbial infections. 13C-isotope labeling experiment has been performed on
cell cultures and hairy roots of Catharanthus roseus to measure fluxes through
some pathways. However, due to the complexity of the total metabolic network
in an intact plant, no experiments have yet been carried on C. roseus plants. In
this study, [1-13C] Glucose was first applied to C. roseus seedlings grown in
culture medium. In a time course the amount and position of 13C incorporation
into the metabolites were analysed by 1H-NMR and 1H-13C HSQC NMR. The
results show that the fed 13C-isotope was efficiently incorporated into and
recycled in metabolism of the intact C. roseus plant. The C. roseus plants seem
to be a good system for metabolic fluxes analysis.
144
Chapter 7
13
CLE to study metabolism in Catharanthus roseus
Introduction
Metabolic flux analysis (MFA) aims at the quantitation of the carbon flow
through a metabolic network by measuring the enrichment and position of
labels in the various measurable metabolites after feeding a labeled
precursorin-vivo or in-vitro. Though now common in microorganisms, in plants,
with their complex secondary metabolic pathways, MFA is so far mostly
focused on primary metabolism. In fact, each metabolic flux reflects the
function and performance of a specific pathway in a plant’s development and its
interaction with the environment, e.g. defense against herbivores or
microorganisms (Ratcliffe and Shachar-Hill, 2006). Consequently metabolic
fluxes represent the fourth dimension of a living organism. There are three
dimensions of space, which form the phenotype, but the dynamics, the fluxes,
represent life. Flux analysis based on 13C-isotope labeling experiments (13CLE)
has been established as an effective method for determining the flux distribution
through the compartmented pathways of primary metabolism in plant cells. The
13
C isotope is not radioactive, thus convenient to be used to label the
metabolites in the pathways. Usually a specifically 13C-isotope labeled substrate,
e.g. [1-13C] glucose, is used in a CLE study. After feeding, this labeled material
is distributed over the various metabolic pathways. At various time points the
distribution of the label over the various measurable metabolites, is measured
by using different NMR or MS instruments (Szyperski, 1998; Mollney et al.,
1999). By NMR the position of the label as well as the enrichment on every
position in a molecule can be measured. By MS the overall enrichment of a
molecule can be determined, whereas the position is can only to some extent be
determined by analysis of the fragments.
There are two strategies for 13C MFA: one is dynamic labeling strategy
(time course experiments), the other is steady-state labeling strategy. The
dynamic labeling strategy has an advantage in studying small partial networks
and it is particularly effective for the analysis of secondary metabolism
(Ratcliffe and Shachar-Hill, 2005). In this approach a specific labeled advanced
precursor of a pathway is pulse fed, and after a given time the incorporation is
measured in the products of the pathway involved. In a steady-state labeling
strategy the organisms is permanently growing in a medium containing a very
early substrate for primary metabolism (e.g. a labeled sugar of pyruvate) and the
diffusion of the label through all pathways is monitored by measuring
incorporation and position of the label in all measurable metabolites. This
approach is usually utilized in studies of central carbon metabolism. In fact the
limiting factor in flux analyses in plants is the detection limits for the various
metabolites, as the levels of primary metabolites in plants is many fold higher
than of secondary metabolites, the dynamic range analytical tools hamper the
analysis of minor compounds. Therefore often specific and selective extraction
methods are used for the dynamic approach, whereas for the steady state
approach one uses the more general metabolomics analytical protocols.
145
Chapter 7
13
CLE to study metabolism in Catharanthus roseus
In Catharanthus roseus, 13C label have been applied for both pathway
elucidation and systemwide flux quantification. By feeding [1-13C] glucose to a
cell culture of C. roseus with 13C NMR spectroscopy (Contin et al, 1998) the
biosynthetic pathway of secologanin was elucidated from which secologanin
was found to originate from the triose-phosphate pathway. Salicylic acid
biosynthesis was uncovered in C. roseus cell cultures by a retrobiosynthetic
study based on 13C feeding experiments (Mustafa et al., 2009). Flux
quantification in central carbon metabolism of C. roseus hairy roots by 13C
labeling-based flux analysis, and quantitative assessment of crosstalk between
the two isoprenoid biosynthesis pathways in cell cultures of C. roseus were also
reported (Sriram et al. 2007; Schuhr et al. 2003). Antonio et al. (2013) used
plant cell suspension cultures of C. roseus to study the the changes in fluxes
after elicitation with jasmonate. The incorporation of fully labeled pyruvate was
measured by GC-MS and UPLC-MS. The elicitation was found to disturb
various metabolic pathways, as could be concluded from the differences in
incorporation of labels. Up to now 13CLE-based MFA has not been
implemented on intact C. roseus plants. The major reason is that intact plants
are a more complex metabolic system than cell cultures or hairy root cultures
which only have one a few different cell types. For example, previous research
showed that some valuable TIAs (e.g. vindoline, vinblastine and vincristine) can
only be produced in leaves of C. roseus, not in cell cultures and hairy roots, due
to the tissue- and cell-specific organization of TIA biosynthesis. So a more
detailed understanding of carbon flux distribution in the complex metabolic
networks of intact C. roseus plants is a prerequisite for progress in metabolic
engineering of TIA production in order to feed the rapidly growing market
demands of these important TIAs.
In this study, the fate of [1-13C] glucose fed to the intact C. roseus plants
via the root system was analyzed in considerable detail. Labeling patterns of
targeted metabolites were deduced from previous publications (Lundstrom et al.,
2007; Mustafa et al., 2009; Contin et al., 1998) (Fig. 1), and confirmed by the
current experiment. By tracing the label in some of the detected primary and
secondary metabolites through a time course, we have information about the 13C
incorporation status of these compounds and thus in the metabolic fluxes in the
C. roseus plant metabolism and the channeling of carbon into the MIA
biosynthesis. Also the metabolic changes after elicitation were measured in this
model.
146
into the metabolite.
which 13C incorporated
indicates the round in
in front of carbons
The superscript number
round of the TCA cycle.
positions in the first
indicate 13C enriched
filled cycles in red
feeding. Carbons and
based on [1-13C] glucose
4-O-caffeoylquinic acid
chlorogenic acid and
loganic acids,
TCA cycle, amino acids,
Fig. 1 Label pattern of
Chapter 7
13
CLE to study metabolism in Catharanthus roseus
147
Chapter 7
13
CLE to study metabolism in Catharanthus roseus
Materials and methods
Plant material and in-vitro culture
Catharanthus roseus seeds (Pacifica Cherry Red cultivar) were purchased
from PanAmerican Seed Company (USA). The seeds were surface sterilized in
75 % of ethanol (v/v) and 10% of NaClO (v/v) for 1 min and 15 min
(respectively), and subsequently washed three times with sterile distilled water.
Sterilized seeds were germinated on solid MS medium (basal culture medium
by Murashige and Skoog, 1962) with 1% non-labeled glucose. Finally, 54
seedlings were obtained, sub-cultured every 2 weeks in the same MS solid
medium and used before flowering for the labeling experiments. After 10 weeks,
19 plants as control were transferred to glass tubes and reared (each) with 5 ml
of 10 g/L non-labeled glucose solution; whereas the other 35 plants were placed
in separate glass tubes containing 5 ml of 10 g/L [1-13C] glucose solution. The
plant cultures were grown in a climate chamber under a 16 h light and 8 h dark
photoperiod at 25 ±2 °C.
Chemicals
Murashige & Skoog (MS) medium (including vitamins) and gelrite
(strength: 550 ~ 850 g/cm2) were purchased from Duchefa Biochemie. D
(+)-Glucose (>99.0%) was obtained from Fluka Chemie (Buchs, Germany),
whereas [1-13C]-D- glucose (>99.0%, with > 99% atom 1-13C) was from Campro
Scientific (Veenendaal, The Netherlands). Jasmonic acid (JA) was from
Sigma-Aldrich Chemie (Steinheim, Germany).
Jasmonic acid elicitation
A stock solution of 10 mg/ml of JA 40% EtOH was prepared, filter
sterilized and used for elicitation. After 5 days submerging the plant roots with
5 ml of [1-13C] glucose solution (1% w/v), 11 μl of the JA stock solution was
aseptically spiked into each tube. The control samples received only the same
volume of 40% EtOH. The plants were harvested at 0 h, 6 h, 24 h, and 72 h
after treatment; young leaves, old leaves, stems and roots of C. roseus plants
were harvested separately, immediately frozen and ground in liquid nitrogen
into powder and freeze-dried for 72 h before NMR extraction (5 replicates per
sample).
NMR analysis
1
H-NMR spectra were recorded in CH3OH-d4 using a Bruker DMX 600
148
Chapter 7
13
CLE to study metabolism in Catharanthus roseus
MHz spectrometer, whilst the coherence order selective gradient heteronuclear
single quantum coherence (HSQC) spectra were recorded in CH3OH-d4 by a
Bruker AV 500 MHz spectrometer. HSQC spectra were recorded for a data
matrix of 256 × 2048 points covering 30182.7 × 7812.5 Hz with 64 scans
for each increment (Kim et al., 2010). INEPT transfer delays were optimized
for a heteronuclear coupling of 145 Hz and a relaxation delay of 1.5 s was
applied. Data was linear predicted in F1 to 512 × 2048 using 32 coefficients
and then zero-filled to 2048 × 2048 points prior to echo-anti echo type 2D
Fourier transformation and a sine bell shaped window function shifted by π/2 in
both dimensions was applied. 1D projection along the F1-axis was extracted
using the build-in positive projection tool of Topspin (version 2.1, Bruker
Biospin).
The signal intensity of carbons at certain positions of a given metabolite
was obtained from peak height in the 13C-dimension spectra abstracted from the
2D HSQC spectra. The signal height of CH3OH-d4 was selected as standard and
set as 1 in both labeled and non-labeled samples. The other signals were
normalized and expressed relative to this signal. 13C signal intensity ratio was
calculated by comparison of normalized 13C signal heights between 13C labeled
and non-labeled samples.
Results and discussion
Comparison of growth and metabolism of C. roseus plants
grown in the solid culture medium versus soil
Two batches of C. roseus seeds (each containing of 10 seeds) were
germinated, one batch in soil and another one in solid MS medium with glucose.
They were kept in the same condition of light and temperature. The height, the
size and the leaf pairs of the plants from seedling until flowering were
monitored and recorded regularly to determine the growth state of plants.
After 10 ~12 days, seeds in both batches germinated and produced their
first pair of leaves. In the first 3 weeks after germination, there were no
significant differences of height, leaf pairs and leaf size between plantlets
grown in MS medium and in the soil (Fig. 2). However, in the following days,
the plantlets in MS medium provided one more pair of leaves than those in soil
did, but the leaf size was much smaller than that of plantlets grown in the soil
(Fig. 2A and 2B). Moreover, the soil plantlets grew higher than those grown in
MS medium (Fig. 2C). Plantlets in MS medium entered flowering time around
100 days after sowing, whereas those in soil flowered at 75 days. The plantlets
grown in soil had a higher growth rate and a larger biomass than those grown in
MS medium.
149
Chapter 7
13
CLE to study metabolism in Catharanthus roseus
Fig. 2 Comparison of the number of leaf pairs (A), leaf size (B) and height (C) of
Catharanthus roseus plants grown in MS medium and soil during the development
stage.
Metabolic differences between the plants grown in soil and MS medium
were observed by 1H-NMR (Fig. 3). The 1H-NMR spectra showed that
qualitatively metabolites of plants grown in soil or MS medium were similar,
but the levels varied (Table 1). Plants grown in soil produced higher levels of
organic acids and sugars (malate, fumaric acid, glucose, and sucrose) than those
grown in MS medium, indicating a low function/ reduced level of
carbon-fixation in the leaves of the MS grown plants. Also secondary
metabolites (such as secologanin, vindoline, quercetin and kaempherol) were
found in higher levels in soil-grown plants than the plants grown in MS medium.
On the other hand, plants cultured in MS medium displayed significantly higher
levels of arginine, glutamine and asparagine but relatively low level of glucose
and sucrose. The levels of threonine, glutamate, quinic acid and lactic acid were
also higher in plants grown in MS medium than those in soil.
Fig. 3 1H-NMR spectrum of the crude extracts of Catharanthus roseus plants grown
in soil (A) and MS medium (B).
150
Chapter 7
13
CLE to study metabolism in Catharanthus roseus
Table 1. Comparison of metabolite levels in Catharanthus roseus plants grown in
soil and MS medium, based on 1H-NMR
Compounds
Vindoline
Threonine
Lactic acid
Alanine
Arginine
Quinic acid
Glutamate
Glutamine
Malate
Asparagine
β-glucose
α-glucose
Sucrose
Chlorogenic acid
Fumaric acid
Catharanthine
4-O-Caffeoyl quinic acid
Quercetin-3-O-glucoside
Kaempherol
Secologanin
Signal intensity
Soil
Medium
(S)
(M)
0.42
0.22
0.27
0.34
0.14
0.22
0.54
0.51
0.82
4.27
0.21
0.30
1.25
2.14
2.94
7.08
5.96
1.82
0.03
0.45
0.67
0.13
0.42
0.08
1.34
0.39
0.12
0.11
0.10
0.07
0.20
0.17
0.15
0.12
0.10
0.04
0.13
0.08
0.13
0.03
Signal intensity ratio
(S/M)
1.91
0.79
0.64
1.06
0.19
0.70
0.58
0.42
3.27
0.07
5.15
5.25
3.44
1.09
1.43
1.18
1.25
2.50
1.63
4.33
Some groups of metabolites have a close correlation with plant growth and
biomass, like the tricarboxylic acid cycle (TCA) cycle intermediates succinate,
citrate or malate, as well as amino acids (Meyer et al., 2007). Both glutamine
and asparagine are the major compounds for nitrogen fixing, transport and
storage in plants (Lea et al., 2007). With the much more abundant nitrogen
source in the medium than in the soil, the high levels of the amino acids in the
medium grown plants could be explained. Meyer et al., (2007) reported a
negative correlation to the plant biomass with glutamine, which is in line with
our findings. Sucrose starvation may lead to the presence of a large excess of
asparagine in plant cells (Genix et al., 1990). In the present study, the plants
cultured on solid MS medium require an aseptic jar with cap, which limits the
space to grow, and also affects air exchange, CO2 availability and accumulation
of volatiles in the head space if compared with plants grown in soil. Despite the
uptake of carbohydrates from the medium through the roots the growth was less
151
Chapter 7
13
CLE to study metabolism in Catharanthus roseus
than the plants grown in soil which are dependent of carbon fixation by leaves.
The limited availability of CO2 in the sterile closed containers may thus be a
reason for lower biomass production.
[1-13C] glucose feeding experiment and JA elicitation on
Catharanthus roseus plantlets
Samples from different organs (upper and lower leaves, stems and roots)
were measured by proton and carbon NMR. After feeding the plants with [1-13C]
glucose for five days, incorporation of 13C label was found in some primary and
secondary metabolites detected in all organs of the C. roseus plantlets. 13C
signals of some primary and secondary metabolites were assigned based on the
“in-house” database and some references (Choi et al., 2004; Mustafa et al.,
2009), and confirmed in the chapter 4. Totally 14 amino acids, 9 organic acids,
2 carbohydrates, 6 phenylpropanoids, 5 TIAs, 2 terpenoids and 3 other
compounds were identified. Among them, only the metabolites from which
characteristic signals were clearly visible and non-overlapping in both 1H and
13
C NMR spectra were quantified (Fig. 4). Those include some primary
metabolites like amino acids (threonine, alanine, asparagine, aspartate,
glutamine, glutamate and arginine) and malic acid (Fig. 4A), as well as some
secondary
metabolites
like
phenylpropanoids
(chlorogenic
acid,
4-O-caffeoylquinic acid), terpenoids (loganic acid and secologanin) and TIA
(vindoline) (Fig. 4C).
Figure 5 shows the 13C-dimension HSQC spectra and 1H-NMR spectra of
the non-labeled sample and the 13C-enriched sample determined in CH3OH-d4.
As expected the superimposed 1H-NMR spectra of leaves (Fig. 5) and stems
(Data not shown), did not show any significant difference in proton signal
intensity of the metabolites for the control and the 13C-enriched sample.
Production of these sugars caused a decrease in the levels of glucose and
sucrose in roots but did not affect the metabolite levels in other organs. Except
this, there was no significant change in metabolites levels of the plants fed with
labeled- and non-labeled glucose solution (Table 2). This information is
necessary to confirm that the 13C signals of the spectra of enriched samples are
due to incorporation of label, and not because of higher levels of production of
the metabolites. Superimposed 13C-dimension HSQC spectrum showed that the
enriched sample had a much higher intensity of 13C signals than the non-labeled
one. The results indicate that the [1-13C] glucose-fed C. roseus plants grew
normally, and incorporated the labeled sugar into its metabolic network.
Previous work with Arabidopsis support that 13C feeding does not in itself
distort the fluxes through the metabolic network in a plant (Kruger et al., 2007).
152
Chapter 7
13
CLE to study metabolism in Catharanthus roseus
153
Chapter 7
13
CLE to study metabolism in Catharanthus roseus
Fig. 4 2-D [13C, 1H] HSQC spectrum of CH3OH-d4 extract of Catharanthus roseus
leaves. A, spectrum region displaying amino acid resonances; B, spectrum region
displaying sugar resonances; C, spectrum region displaying aromatic resonances. 1,
alanine; 2, threonine; 3, arginine; 4, glutamine; 5, glutamate; 6, malate; 7, aspartate;
8, asparagine; 9, vindoline; 10, loganic acid; 11, chlorogenic acid; 12, 4-O-Caffeoyl
quinic acid.
Fig. 5 Superimposed 1H-NMR Spectra and 13C-dimension HSQC spectrum of
labeled and non-labeled Catharanthus roseus plants. Spectra in green were
non-labeled plants sample, spectra in red were 13C labeled plants sample.
154
13
Chapter 7
CLE to study metabolism in Catharanthus roseus
Table 2. Comparison of metabolite levels in different organs between labeled and
non-labeled Catharanthus roseus plants. *nd: not detected
Compounds
Ratio of metabolite levels in labeled and
non-labeled samples, (L0/C0), based on 1H-NMR
Upper leaf
Lower leaf
Stem
Root
β-glucose
α-glucose
1.04
0.97
0.76
0.67
1.01
1.03
0.42
0.39
Sucrose
Threonine
Alanine
Arginine
0.95
1.25
1.12
1.16
0.62
0.97
0.92
0.75
0.82
0.88
0.96
0.82
0.65
1.05
0.82
0.74
Glutamate
Glutamine
Aspartate
Asparagine
1.13
0.78
1.28
0.88
0.95
0.60
0.83
0.85
0.89
0.89
0.87
0.77
0.70
0.81
1.22
0.93
Malic acid
Fumaric acid
Vindoline
Chlorogenic acid
4-O-caffeoylquinic
acid
Quercetin
Kaempferol
1.63
0.90
1.07
1.54
0.85
0.77
0.89
0.85
0.98
0.67
1.20
0.75
0.95
nd
nd
nd
1.16
0.90
1.00
nd
1.50
1.30
1.33
1.00
nd
nd
nd
nd
Secologanin
1.50
1.00
nd
nd
Loganic acid
1.10
1.00
0.94
0.89
13
C Incorporation into primary and secondary metabolites
The signals in the HSQC spectra of the enriched samples were identified
(Fig. 4). The carbon position of 13C incorporation into a metabolite was
investigated by calculating 13C signal intensity ratios between the same carbons
of the metabolite in labeled and non-labeled samples (Table 3).
Among amino acids, the signals corresponding to C at δ 16.98, C-3 of
alanine, exhibited a high 13C relative enrichment ratio. Glycolysis introduces the
C-1 or C-6 of glucose into alanine C-3 (Lundstrom et al., 2007). Carbon signals
at δ 20.47 of threonine and at δ 37.21 of aspartate also showed a relatively high
labeling. The carbons of arginine and asparagine were apparently less labeled.
155
13
Chapter 7
CLE to study metabolism in Catharanthus roseus
Table 3. The chemical shifts, peak height and relative enrichment ratio of the same
carbon signals in metabolites in labeled and non-labeled Catharanthus roseus
plants.
H
C
Control
Labeled
4.58
1.49
2.05
2.38
3.71
2.14
2.46
3.72
1.72
1.92
3.24
2.64
2.83,
2.96
3.96
1.34
2.35,
2.72
97.04
16.98
27.11
31.83
55.02
27.74
34.44
55.67
24.9
28.53
41.38
37.21
3.2E+07
8.0E+06
4.6E+07
1.6E+08
3.0E+08
2.1E+06
6.3E+07
9.8E+06
1.7E+07
2.1E+07
5.9E+07
1.0E+07
1.3E+08
2.1E+07
3.9E+07
1.7E+08
2.3E+08
7.0E+06
1.5E+08
3.9E+07
6.7E+06
8.1E+06
2.1E+07
7.0E+06
Relative
intensity to
CH3OH-d4
Con Lab
trol eled
(Y)
(X)
0.17 2.89
0.04 0.47
0.23 0.88
0.80 3.72
1.56 5.12
0.01 0.16
0.32 3.36
0.05 0.86
0.09 0.15
0.11 0.18
0.30 0.47
0.05 0.16
35.23
1.2E+08
4.0E+07
0.62
0.90
1.44
52.21
20.47
1.7E+08
8.8E+06
4.7E+07
6.2E+06
0.89
0.05
1.05
0.14
1.19
3.08
43.4
6.0E+07
8.5E+07
0.31
1.91
6.21
7.07
123.1
1.2E+07
7.2E+06
0.06
0.16
2.53
7.09
124.2
1.7E+06
2.5E+06
0.01
0.06
6.63
1.07
7.03
0.49
12.69
146.1
7.43
2.5E+06
6.5E+05
6.0E+06
5.6E+06
5.2E+06
2.4E+06
0.01
0.00
0.03
0.13
0.12
0.05
9.96
34.49
1.76
Chemical shift
(δ) (ppm)
Peak height
Compound
Glucose
Alanine
Glutamine
Glutamate
Arginine
Aspartate
Asparagine
Threonine
Malate
Chlorogeni
c acid
4-O-Caffeo
yl
quinic
acid
Loganic
acid
Vindoline
Relative
enrichm
ent ratio
(X/Y)
17.31
11.26
3.75
4.63
3.29
14.81
10.45
17.14
1.77
1.68
1.56
3.05
Glutamate (C-3 at δ 27.74, C-4 at δ 34.44, C-5 at δ 55.67) and glutamine
(C-3 at δ 27.11, C-4 at δ 31.83 and C-5 at δ 55.02) showed clear high 13C
incorporation. The relative enrichment ratios of C-3 and C-2 of glutamine were
lower than that of C-4, which indicate the entry of a diluting flux of C4
156
Chapter 7
13
CLE to study metabolism in Catharanthus roseus
compounds into the TCA cycle (Malloy et al., 1988). For glutamate, however,
C-4 had a lower relative enrichment ratio than C-3 and C-2. Non-symmetrical
enrichment ratios of C-2 and C-3 implies that there might be a form of
channeling that converts oxoglutarate C-4 to oxaloacetate C-2 or C-3
(Dieuaide-Noubhani et al., 1995).
In plant cells, the labeling of amino acids alanine, glutamate, and aspartate
are found to reflect that of the corresponding α-oxoacids: pyruvate,
α-oxoglutarate, and oxaloacetate, respectively (Salon et al., 1988). The organic
acid malate showed a 6-fold increased intensity for the carbon signal at δ 43.40.
Besides primary metabolites, secondary metabolites also exhibited clear
13
C incorporation. Two phenylpropanoids, chlorogenic acid and its isomer
4-O-caffeoyl quinic acid, have an increased 13C intensity of C-6. Incorporation
of 13C could be observed for C-3 and C-10 of loganic acid. These results are in
agreement with the prediction shown in Fig. 1. The signal corresponding to
C-18 of vindoline in the labeled sample was 2-fold higher than in the spectrum
of the control.
13
C Incorporation in different organs
Based on 1H-NMR spectra, relative levels of primary and secondary
metabolites in different organs were calculated by normalizing the integral of
signal peaks to the internal standard (TSP). Table 4 showed that leaves,
especially upper leaves, contained higher levels of amino acids,
phenylpropanoids, iridoids and vindoline than stems and roots. In roots
phenylpropanoids and vindoline which biosynthesis dependent on chloroplasts
were not detected, whereas iridoids displayed a much lower level in roots while
glucose and sucrose had relatively higher levels than in other organs.
The incorporation of 13C in different organs (upper leaf, lower leaf, stem
and root) were also investigated by comparison of relative enrichment ratios in
order to have a clue about the accumulation of label in different organs and its
connection with transport and compartmentation of the pathways in the plants
(Table 5). From the 13C dimension of HSQC spectra of all organs, 13C signals of
labeled samples showed an apparently higher intensity in the amino acid and
sugar areas than those of non-labeled ones (Fig. 6), which indicated that
13
C-isotope was efficiently incorporated into the primary metabolism of intact C.
roseus plants via the roots. Glucose had higher 13C intensity ratio in lower
leaves and roots but relatively low in upper leaves and stems, thus showing a
time dependent distribution through the plant. Glutamate and aspartate, directly
derived from α-ketoglutarate and oxaloacetate of the TCA cycle, showed clear
13
C enrichment in all organs. So did malate, one of the bricks in the TCA cycle.
Meanwhile, glutamate, aspartate and malate all displayed the highest 13C
intensity ratio in roots. These results indicate that 13C was efficiently
incorporated and recycled in the primary metabolism of intact plants. Upper
leaves had higher levels and higher relative enrichment ratios of glutamate and
157
Chapter 7
13
CLE to study metabolism in Catharanthus roseus
malate compared with lower leaves, reflecting the faster rate of TCA cycle in
the upper parts for plants growing. The glutamate-derived amino acids
glutamine and arginine displayed a different pattern of 13C incorporation.
Glutamine showed 13C incorporation in all organs with the highest intensity
ratio in roots and the lowest in stems, whereas arginine showed low 13C
incorporation in all organs, implying a low flux in its biosynthetic pathway and
low usage for other pathways. The 13C incorporation of aspartate-derived amino
acids asparagine and threonine was also different. Threonine had relatively high
13
C incorporation in upper leaves and roots, but relatively low in lower leaves
and stems, indicating a high turnover in the upper leaves. Asparagine, except for
roots, displayed low 13C incorporation in the other organs. Pyruvate-derived
alanine exhibited the lowest relative enrichment ratio in upper leaves, whilst the
highest was found in stems and roots.
Table 4 Relative level of metabolites in different organs of Catharanthus roseus
based on 1H-NMR spectra. *nd: not detected
Compounds
β-glucose
α-glucose
Sucrose
Threonine
Alanine
Arginine
Glutamate
Glutamine
Aspartate
Asparagine
Malic acid
Fumaric acid
Vindoline
Chlorogenic acid
4-O-caffeoylquinic acid
Quercetin
Kaempferol
Secologanin
Loganic acid
Relative levels of metabolites
Upper leaf
Lower leaf
Stem
Root
0.46
0.89
0.95
1.36
0.34
0.56
0.62
0.83
0.20
0.33
0.53
0.81
0.45
0.44
0.45
0.17
0.45
0.46
0.29
0.17
3.19
5.93
5.09
1.07
3.05
2.15
2.92
0.91
3.72
1.74
7.91
1.38
1.07
0.93
0.41
0.22
2.82
1.25
1.84
0.44
0.32
0.40
0.22
0.09
0.11
0.11
0.02
nd
0.28
0.09
0.05
nd
0.25
0.37
0.03
nd
0.17
0.15
0.04
nd
0.05
0.05
0.03
0.03
0.09
0.10
0.02
nd
0.02
0.02
0.0006
0.0002
0.07
0.14
0.11
0.05
158
13
Chapter 7
CLE to study metabolism in Catharanthus roseus
Table 5. Relative enrichment ratios of the carbons of some metabolites in different
organs of Catharanthus roseus plants fed with [1-13C] glucose. *nd: not detected
Compounds
16.98
20.47
24.9
28.53
41.38
27.11
31.83
55.02
27.74
34.44
55.67
35.23
52.21
37.21
43.4
97.04
7.43
12.69
146.1
123.12
146.8
Relative enrichment ratio
(Labeled:Control)
Upper
Lower
stem
leaf
leaf
9.76
32.38
118.89
3.55
1.06
1.39
1.89
1.12
1.67
1.58
1.07
1.17
1.52
0.91
0.91
2.80
2.34
1.89
3.21
4.03
3.09
2.34
1.38
2.01
11.79
5.39
3.36
7.21
3.37
4.63
15.49
2.72
5.11
1.21
0.75
1.09
1.17
0.95
1.23
2.25
3.40
4.07
4.67
4.41
7.82
30.96
55.55
15.01
2.96
nd
nd
7.66
3.75
4.26
27.96
13.77
6.59
2.88
1.42
nd
93.69
nd
nd
124.16
10.35
13
C
Chemical
Shift
(ppm)
Alanine
Threonine
Arginine
Glutamine
Glutamate
asparagine
Aspartate
Malate
β-glc
Vindoline
Loganic acid
Chlorogenic acid
4-O-Caffeoyl quinic
acid
nd
nd
Root
84.86
18.91
2.99
1.15
1.66
6.38
6.70
8.43
20.65
16.75
25.06
5.67
4.18
36.29
26.51
32.79
nd
23.62
24.79
nd
nd
nd
159
Chapter 7
13
CLE to study metabolism in Catharanthus roseus
Fig. 6 13C dimension of HSQC spectra of amino acids (δ 10~55 ppm) and
secondary metabolites (δ 105~150 ppm) in different organs of Catharanthus
roseus after feeding [1-13C] glucose. L, labeled samples; N, non-labeled
samples; M, malate
160
Chapter 7
13
CLE to study metabolism in Catharanthus roseus
In stems and roots, no 13C signals of vindoline, chlorogenic acid and
4-O-Caffeoyl quinic acid were detected with or without feeding [1-13C] glucose.
Vindoline is not found in roots due to its tissue-specific biosynthesis requiring
chloroplasts for one of its biosynthetic steps (Zhou et al., 2011; Murata et al.,
2008; Abbasi et al., 2007; Shukla et al., 2006; Murata and De Luca, 2005; De
Luca and Cutler, 1987). The 13C signal of loganic acid at δ 12.69 and 146.1 ppm
was clearly present and showed a high relative enrichment ratio at the spectra of
all organs while that of secologanin at δ 121.53 ppm was only found in the
spectra of leaves. It was difficult to calculate the relative enrichment ratio of
secologanin due to the signal overlapping. In roots and stems secologanin was
too low for further analysis. The high levels of loganic acid in the roots are in
line with a previous study that reported that LAMT activity, which converts
loganic acid into loganin (the direct substrate of secologanin), was 4 to 8 times
lower in hairy roots than that in the other organs of the plant (Murata et al.,
2008).
Effect of JA elicitation on 13C fluxes into metabolic pathways
JA was spiked into the labeled glucose solution at the 6th day after
submerging the plant roots in the solution. The control plants were also reared
in labeled glucose solution but without JA elicitation. Leaves were harvested at
0, 6, 24 and 72 h (6, 7 and 9 d of incubation with the labeled glucose solution)
after elicitation and measured by 1H-NMR and HSQC.
For control plants, NMR spectra showed that the enrichments of malic acid and
of the amino acids alanine, arginine, glutamate, glutamine, aspartate and
asparagine in the leaves were nearly identical at 6 and 9 d of incubation with the
labeled glucose solution (Fig. 7), suggesting the establishment of steady state at
6 d. However, the incorporation of label in glucose and threonine increased
continuously within the measured period of 9 days.
Besides, loganic acid and chlorogenic acid kept the same enrichments
while vindoline and 4-O-caffeoylquinic acid showed an increase of the
enrichments within 9 days. Previous study with C. roseus hairy roots grown in
the light showed that the 13C label was not diluted by CO2 fixation (Schuhr et
al., 2003). In tobacco plants grown on agar containing labeled glucose, the
metabolism was studied on a quantitative basis showing that the labeled glucose
was efficiently absorbed via the root system, metabolized and recycled
(Ettenhuber et al., 2005). Our results indicate that the C. roseus plant system
can reach a relatively steady isotopic state with plants growing in 13CLE.
161
glucose.
incubation in [1-13C]
samples (without
red bars (U): unlabeled
bars: control samples;
elicited samples; black
glucose. Grey bars: JA
plants with [1-13C]
Catharanthus roseus
incubation of
metabolites during
primary and secondary
enrichment ratio of
Fig. 7 Relative
Chapter 7
13
CLE to study metabolism in Catharanthus roseus
162
Chapter 7
13
CLE to study metabolism in Catharanthus roseus
JA elicitation had little effect on the level of most metabolites, except
glutamate, glutamine, vindoline and loganic acid. Although JA induced an
increase of glutamate and glutamine levels (Fig. 8), their relative enrichment
ratio remained unchanged compared with the controls. At the same time, the
enrichment of alanine at C-3 showed an increase without levels changing
compared to the controls. Vindoline levels showed an increase and reached the
highest level at 72 h (23% higher than the controls) after JA treatment (Fig. 8).
However, the relative enrichment ratio of the C-18 signal of vindoline was
lower in JA-elicited samples than in the controls, especially at 6 h (Fig. 7). The
level of loganic acid decreased with time (Fig. 8), leading to a dramatical
decrease of its enrichment at both C-3 and C-10 from 6 h to 72 h. The levels of
chlorogenic acid and 4-O-caffeoyl quinic acid in the time course did not change
after JA elicitation (Fig. 8), but the enrichments were lower than those of the
control labeled samples (Fig. 7). 13C fluxes to various metabolic pathways, like
glutamate and loganic acid, could be disturbed within 24 h after MeJA treatment
(Antonio et al., 2013).
Fig. 8 Relative levels of metabolites in Catharanthus roseus leaves after JA
elicitation. Grey bars: JA elicited samples; black bars: control samples.
163
Chapter 7
13
CLE to study metabolism in Catharanthus roseus
Conclusion
This study reports a comprehensive 13C labeling-based metabolomics of a
plant system. [1-13C] glucose was efficiently absorbed via the root system and
recycled in the whole plant of C. roseus. The plant system of C. roseus could
reach a relatively steady isotopic state in 13CLE, which appears to be well
qualified to study flux contributions in the biosynthesis of sink metabolites for
system biology. Combined with exogenous elicitation, 13C MFA appears to be a
good tool to study the crosslink among pathways in the complicated plant
metabolic network
164
Chapter 7
13
CLE to study metabolism in Catharanthus roseus
Reference
Abbasi BH, Tian CL, Murch SJ, Saxena PK, Liu CZ (2007) Light-enhanced
caffeic acid derivatives biosynthesis in hairy root cultures of Echinacea
purpurea. Plant Cell Rep 26: 1367-1372.
Antonio C, Mustafa NR, Osorio S, Tohge T, Giavalisco P, Willmitzer L,
Rischer H, Oksman-Caldentey KM, Verpoorte R, Fernie AR (2013)
Analysis of the interface between primary and secondary metabolism in
Catharanthus roseus cell cultures using 13C-stable isotope feeding and
coupled mass spectrometry. Mol Plant 6: 581-584
Choi YH, Tapias EC, Kim HK, Lefeber AWM, Erkelens C, et al. (2004)
Metabolic discrimination of Catharanthus roseus leaves infected by
phytoplasma using 1H-NMR spectroscopy and multivariate data
analysis. Plant Physiol 135: 2398-2410.
Contin A, van der Heijden R, Lefeber AWM, Verpoorte R (1998) The iridoid
glucoside secologanin is derived from the novel triose
phosphate/pyruvate pathway in a Catharanthus roseus cell culture.
FEBS letters 434: 413-416.
De Luca V, Cutler AJ (1987) Subcellular localization of enzymes involved in
indole alkaloid biosynthesis in Catharanthus roseus. Plant Physiol 85:
1099-1102.
Dieuaide-Noubhani M, Raffard G, Canioni P, Pradet A, Raymond P (1995)
Quantification of compartmented metabolic fluxes in maize root tips
using isotope distribution from 13C-or 14C-labeled glucose. J Biol
Chem 270: 13147-13159.
Ettenhuber C, Radykewicz T, Kofer W, Koop H-U, Bacher A, et al. (2005)
Metabolic flux analysis in complex isotopolog space. Recycling of
glucose in tobacco plants. Phytochemistry 66: 323-335.
Genix P, Bligny R, Martin J-B, Douce R (1990) Transient accumulation of
asparagine in sycamore cells after a long period of sucrose starvation.
Plant Physiol 94: 717-722.
Kim HK, Khan S, Wilson EG, Kricun SDP, Meissner A, et al. (2010) Metabolic
classification of South American Ilex species by NMR-based
metabolomics. Phytochemistry 71: 773-784.
Kruger NJ, Huddleston JE, Le Lay P, Brown ND, Ratcliffe RG (2007) Network
flux analysis: Impact of 13 C-substrates on metabolism in Arabidopsis
thaliana cell suspension cultures. Phytochemistry 68: 2176-2188.
Lea PJ, Sodek L, Parry MA, Shewry PR, Halford NG (2007) Asparagine in
plants. Ann App Biol 150: 1-26.
Lundström P, Teilum K, Carstensen T, Bezsonova I, Wiesner S, et al. (2007)
Fractional 13C enrichment of isolated carbons using [1-13C]-or
[2-13C]-glucose facilitates the accurate measurement of dynamics at
backbone Cα and side-chain methyl positions in proteins. J Biomol
NMR 38: 199-212.
165
Chapter 7
13
CLE to study metabolism in Catharanthus roseus
Malloy CR, Sherry AD, Jeffrey F (1988) Evaluation of carbon flux and
substrate selection through alternate pathways involving the citric acid
cycle of the heart by 13C NMR spectroscopy. J Biol Chem 263:
6964-6971.
Meyer RC, Steinfath M, Lisec J, Becher M, Witucka-Wall H, et al. (2007) The
metabolic signature related to high plant growth rate in Arabidopsis
thaliana. Proc Nat Acad Sci 104: 4759-4764.
Möllney M, Wiechert W, Kownatzki D, de Graaf AA (1999) Bidirectional
reaction steps in metabolic networks: IV. Optimal design of isotopomer
labeling experiments. Biotechnol Bioeng 66: 86-103.
Murashige T, Skoog F (1962) A revised medium for rapid growth and bio
assays with tobacco tissue cultures. Physiol Plantarum 15: 473-497.
Murata J, De-Luca V (2005) Localization of tabersonine 16-hydroxylase and
16-OH tabersonine-16-O-methyltransferase to leaf epidermal cells
defines them as a major site of precursor biosynthesis in the vindoline
pathway in Catharanthus roseus. Plant J 44: 581-594.
Murata J, Roepke J, Gordon H, De-Luca V (2008) The leaf epidermome of
Catharanthus roseus reveals its biochemical specialization. Plant Cell
20: 524-542.
Mustafa NR, Kim HK, Choi YH, Erkelens C, Lefeber AW, et al. (2009)
Biosynthesis of salicylic acid in fungus elicited Catharanthus roseus
cells. Phytochemistry 70: 532-539.
Mustafa NR, Kim HK, Choi YH, Verpoorte R (2009) Metabolic changes of
salicylic acid-elicited Catharanthus roseus cell suspension cultures
monitored by NMR-based metabolomics. Biotechnol Let 31:
1967-1974.
Ratcliffe RG, Shachar‐Hill Y (2006) Measuring multiple fluxes through plant
metabolic networks. Plant J 45: 490-511.
Salon C, Raymond P, Pradet A (1988) Quantification of carbon fluxes through
the tricarboxylic acid cycle in early germinating lettuce embryos. J Biol
Chem 263: 12278-12287.
Schuhr CA, Radykewicz T, Sagner S, Latzel C, Zenk MH, et al. (2003)
Quantitative assessment of crosstalk between the two isoprenoid
biosynthesis pathways in plants by NMR spectroscopy. Phytochem Rev
2: 3-16.
Shukla AK, Shasany AK, Gupta MM, Khanuja SP (2006) Transcriptome
analysis in Catharanthus roseus leaves and roots for comparative
terpenoid indole alkaloid profiles. J Exp Bot 57: 3921-3932.
Sriram G, Fulton DB, Shanks JV (2007) Flux quantification in central carbon
metabolism of Catharanthus roseus hairy roots by 13C labeling and
comprehensive bondomer balancing. Phytochemistry 68: 2243-2257.
Szyperski T (1998) C-NMR, MS and metabolic flux balancing in biotechnology
research. Q Rev Biophys 31: 41-31106.
Zhou ML, Zhu XM, Shao JR, Tang YX, Wu YM (2011) Production and
166
Chapter 7
13
CLE to study metabolism in Catharanthus roseus
metabolic engineering of bioactive substances in plant hairy root
culture. Appl Microbiol Biotechnol 90: 1229-1239.
167
© Copyright 2026 ExpyDoc