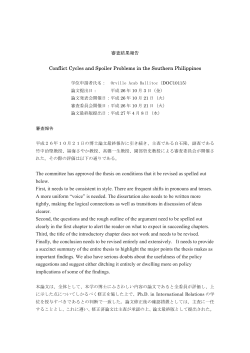
Economic and Social Research Institute
Cabinet Office, Government of Japan
Release date: December 8 2016
平成27年度国民経済計算 年次推計 (支出側系列等)(平成23年基準改定値)
平 成 28 年 12 月 8 日
内
閣
府
経済社会総合研究所
国 民 経 済 計 算 部
FY2015 Annual Estimates of GDP
(Benchmark Year Revision of 2011)
平成27年度国民経済計算年次推計においては、国内総生産(GDP)について、2008SNAへの対応を含む平成23年基準改
定を反映するとともに、①平成27年度については速報値を各種の詳細な基礎統計をもとに推計した第一次年次推計値に改
定し、②平成26年度については新たに入手したデータをもとに推計した第二次年次推計値に改定する。
FY2015 Annual Estimates of GDP, with the introduction of the Benchmark Year Revision of 2011 including the implementation of
SNA2008, replace the preliminary estimate for FY2015 as the First Annual Estimate through incorporating various detailed source
statistics, and GDP in FY2014 is re-estimated as the Second Annual Estimate with additionally available source information.
Ⅰ.国内総生産(支出側)及び各需要項目等
GDP (Expenditure Approach) and Its Components etc.
1.速報値と年次推計値の比較(実質成長率、年度)
Comparison of the Preliminary and the Revised Estimates (Annual Real Growth Rate, Fiscal Year)
(平成23暦年連鎖価格、単位:%)
(Chained (2011) Yen, %)
平成26年度(FY2014)
前年度比 ※1
括弧内は寄与度※2
平成27年度(FY2015)
前年度比 ※1
寄与度(対GDP) ※3
第二次
第一次
第一次
速報値 ※4
速報値 ※4
年次推計値
年次推計値
年次推計値
Preliminary
Revised
Preliminary
Revised
Preliminary
Revised
速報値 ※4
国内総生産(GDP)
-0.9
-0.4
0.9
1.3
国内需要
-1.5
-1.0
0.8
1.1
0.8
1.1
Domestic Demand
-1.9
-1.4
0.8
1.1
0.6
0.8
Private Demand
-2.9
-2.7
-0.1
0.5
-0.1
0.3
Private Consumption
-2.8
-2.6
-0.2
0.3
-0.1
0.2
-3.5
-3.4
-0.5
0.1
-0.2
0.1
-11.7
-9.9
2.4
2.7
0.1
0.1
0.1
2.5
2.1
0.6
0.3
0.1
0.3
0.4
Consumption of
Households
Excluding Imputed
Rent
Private Residential
Investment
Private Non-Resi.
Investment
Change in Private
Inventories
民間需要
民間最終消費支出
家計最終消費支出
除く持ち家の帰属家賃
民間住宅
民間企業設備
民間在庫変動
(0.6)
(0.5)
***
***
***
***
Gross Domestic Product
-0.3
-0.1
0.7
1.2
0.2
0.3
Public Demand
政府最終消費支出
0.1
0.4
1.6
2.0
0.3
0.4
Government Consumption
公的固定資本形成
-2.6
-2.1
-2.7
-2.0
-0.1
-0.1
Public Investment
-0.0
-0.0
Change in Public Inventories
0.2
0.1
(Regrouped) Gross Fixed Capital
Formation
0.1
0.2
Net Exports of Goods & Services
公的需要
公的在庫変動
(再掲)総固定資本形成
財貨・サービスの純輸出
(0.0)
(0.0)
-2.2
(0.6)
***
-0.2
(0.6)
***
1.1
***
0.3
***
財貨・サービスの輸出
7.9
8.7
0.4
0.8
0.1
0.1
Exports of Goods & Services
財貨・サービスの輸入(控除)
3.4
4.1
0.0
-0.2
-0.0
0.0
(Less) Imports of Goods &
Services
(参考)
最終需要
(cf)
***
-0.9
***
1.0
***
***
Final Sales of Domestic Product
国内総所得(GDI)
-0.9
-0.1
2.3
2.7
***
***
Gross Domestic Income
国民総所得(GNI)
-0.4
0.2
2.6
2.7
***
***
Gross National Income
GDPデフレーター
2.5
2.5
1.4
1.4
***
***
GDP Deflator
国内需要デフレーター
2.1
2.1
-0.2
-0.0
***
***
Domestic Demand Deflator
※1: Changes from the previous year
※2: Contributions to changes in GDP in parentheses
※3: Contributions to changes in GDP
※4: 平成28年7-9月期四半期別GDP1次速報(平成17暦年連鎖価格)
Quarterly Estimates of GDP for July-September 2016 (First Preliminary Estimates, Chained (2005) Yen)
2.速報値と年次推計値の比較(実質値・実数、年度)
Comparison of the Preliminary and the Revised Estimates (Level in Real, Fiscal Year)
(平成23暦年連鎖価格、単位:10億円)
(Billions of Chained (2011) Yen)
平成26年度(FY2014)
平成27年度(FY2015)
速報値 ※1
第二次
年次推計値
速報値 ※1
第一次
年次推計値
Preliminary
Revised
Preliminary
Revised
国内総生産(GDP)
524,774.0
510,393.1
529,368.3
517,195.3
Gross Domestic Product
国内需要
515,162.2
517,655.3
519,161.5
523,417.3
Domestic Demand
390,943.7
388,275.4
394,113.2
392,549.9
Private Demand
307,160.2
293,644.8
306,715.7
295,170.4
Private Consumption
299,678.7
286,746.2
298,975.3
287,690.6
248,063.9
235,194.9
246,838.2
235,543.0
民間住宅
13,143.2
14,664.9
13,453.6
15,059.5
Consumption of
Households
Excluding Imputed
Rent
Private Residential
Investment
民間企業設備
70,737.6
79,090.7
72,232.3
79,581.5
Private Non-Resi. Investment
民間在庫変動
259.5
821.1
1,785.1
2,581.1
Change in Private Inventories
124,117.8
129,381.7
124,951.7
130,870.3
Public Demand
政府最終消費支出
102,319.4
103,235.5
103,924.3
105,340.8
Government Consumption
公的固定資本形成
21,780.7
26,056.7
21,195.9
25,546.4
60.2
71.9
11.1
21.8
(再掲)総固定資本形成
105,586.0
119,769.8
106,740.4
120,146.7
(Regrouped) Gross Fixed Capital
Formation
財貨・サービスの純輸出
11,292.7
-7,243.6
11,640.1
-6,391.9
Net Exports of Goods & Services
財貨・サービスの輸出
91,729.3
82,187.7
92,081.6
82,856.0
Exports of Goods & Services
財貨・サービスの輸入(控除)
80,436.6
89,431.4
80,441.6
89,248.0
(Less) Imports of Goods &
Services
民間需要
民間最終消費支出
家計最終消費支出
除く持ち家の帰属家賃
公的需要
公的在庫変動
Public Investment
Change in Public Inventories
(参考)
(cf)
最終需要
***
509,420.0
***
514,393.5
Final Sales of Domestic Product
国内総所得(GDI)
503,087.0
510,011.4
514,760.3
523,706.6
Gross Domestic Income
国民総所得(GNI)
524,766.0
529,059.9
538,381.9
543,338.8
Gross National Income
GDPデフレーター
93.3
101.5
94.6
102.9
GDP Deflator
国内需要デフレーター
97.2
101.7
97.0
101.7
Domestic Demand Deflator
※1: 平成28年7-9月期四半期別GDP1次速報(平成17暦年連鎖価格)
Quarterly Estimates of GDP for July-September 2016 (First Preliminary Estimates, Chained (2005) Yen)
3.速報値と年次推計値の比較(名目成長率、年度)
Comparison of the Preliminary and the Revised Estimates (Annual Nominal Growth Rate, Fiscal Year)
(単位:%)
(%)
平成26年度(FY2014)
前年度比 ※1
括弧内は寄与度※2
速報値 ※4
Preliminary
平成27年度(FY2015)
前年度比 ※1
寄与度(対GDP) ※3
第二次
第一次
第一次
速報値 ※4
速報値 ※4
年次推計値
年次推計値
年次推計値
Revised
Preliminary
Revised
Preliminary
Revised
***
***
国内総生産(GDP)
1.5
2.1
2.3
2.8
国内需要
0.5
1.0
0.6
1.1
0.6
1.1
Domestic Demand
0.1
0.7
0.6
1.1
0.5
0.8
Private Demand
-0.8
-0.5
-0.4
0.5
-0.2
0.3
Private Consumption
-0.7
-0.4
-0.5
0.3
-0.3
0.2
-0.9
-0.6
-0.6
0.3
-0.3
0.1
-8.5
-6.7
2.2
2.7
0.1
0.1
Consumption of
Households
Excluding Imputed
Rent
Private Residential
Investment
1.5
3.8
2.5
1.1
0.3
0.2
Private Non-Resi. Investment
0.3
0.3
Change in Private Inventories
民間需要
民間最終消費支出
家計最終消費支出
除く持ち家の帰属家賃
民間住宅
民間企業設備
民間在庫変動
(0.6)
(0.5)
***
***
Gross Domestic Product
1.9
2.1
0.5
1.0
0.1
0.3
Public Demand
政府最終消費支出
2.2
2.4
1.3
1.7
0.3
0.3
Government Consumption
公的固定資本形成
0.4
0.8
-2.6
-1.4
-0.1
-0.1
Public Investment
-0.0
-0.0
Change in Public Inventories
0.3
0.2
(Regrouped) Gross Fixed Capital
Formation
1.7
1.7
Net Exports of Goods & Services
公的需要
公的在庫変動
(再掲)総固定資本形成
財貨・サービスの純輸出
財貨・サービスの輸出
(0.0)
(0.0)
-0.2
(0.9)
***
1.7
(1.0)
***
1.3
***
0.7
***
10.5
11.5
-1.1
-0.7
-0.2
-0.1
4.0
4.5
-9.3
-9.2
1.9
1.8
財貨・サービスの輸入(控除)
Exports of Goods & Services
(Less) Imports of Goods &
Services
(参考)
最終需要
国民総所得(GNI)
(cf)
***
1.6
2.0
2.4
***
2.5
2.5
***
***
Final Sales of Domestic Product
2.8
***
***
Gross Domestic Income
※1: Changes from the previous year
※2: Contributions to changes in GDP in parentheses
※3: Contributions to changes in GDP
※4: 平成28年7-9月期四半期別GDP1次速報
Quarterly Estimates of GDP for July-September 2016 (First Preliminary Estimates)
4.速報値と年次推計値の比較(名目値・実数、年度)
Comparison of the Preliminary and the Revised Estimates (Level in Nominal, Fiscal Year)
(単位:10億円)
(Billion Yen)
平成26年度(FY2014)
平成27年度(FY2015)
速報値 ※1
第二次
年次推計値
速報値 ※1
第一次
年次推計値
Preliminary
Revised
Preliminary
Revised
国内総生産(GDP)
489,564.2
517,866.6
500,621.3
532,191.4
Gross Domestic Product
国内需要
500,957.4
526,483.5
503,785.6
532,177.5
Domestic Demand
376,231.5
395,031.7
378,459.3
399,409.6
Private Demand
293,204.4
298,414.0
292,000.6
299,862.1
Private Consumption
286,126.2
291,516.1
284,721.6
292,366.9
239,499.3
241,723.2
238,053.9
242,496.5
民間住宅
14,437.6
15,517.5
14,758.5
15,929.6
Consumption of
Households
Excluding Imputed
Rent
Private Residential
Investment
民間企業設備
68,388.8
80,348.1
70,099.5
81,207.8
Private Non-Resi. Investment
民間在庫変動
200.6
752.1
1,600.6
2,410.2
Change in Private Inventories
124,725.9
131,451.8
125,326.3
132,767.9
Public Demand
政府最終消費支出
100,961.2
104,258.0
102,262.8
106,026.3
Government Consumption
公的固定資本形成
23,667.7
27,116.7
23,041.1
26,724.0
96.9
77.1
22.4
17.6
(再掲)総固定資本形成
106,494.2
122,982.4
107,899.2
123,861.4
(Regrouped) Gross Fixed Capital
Formation
財貨・サービスの純輸出
-11,393.1
-8,616.9
-3,164.3
13.9
Net Exports of Goods & Services
財貨・サービスの輸出
88,384.9
92,329.7
87,371.4
91,658.7
Exports of Goods & Services
財貨・サービスの輸入(控除)
99,778.0
100,946.6
90,535.7
91,644.8
(Less) Imports of Goods &
Services
民間需要
民間最終消費支出
家計最終消費支出
除く持ち家の帰属家賃
公的需要
公的在庫変動
Public Investment
Change in Public Inventories
(参考)
(cf)
最終需要
***
517,037.4
***
529,763.7
Final Sales of Domestic Product
国民総所得(GNI)
510,592.6
537,195.2
523,495.9
552,109.3
Gross Domestic Income
※1: 平成28年7-9月期四半期別GDP1次速報
Quarterly Estimates of GDP for July-September 2016 (First Preliminary Estimates)
5.速報値と年次推計値の比較(実質成長率、暦年)
Comparison of the Preliminary and the Revised Estimates (Annual Real Growth Rate, Calendar Year)
(平成23暦年連鎖価格、単位:%)
(Chained (2011) Yen, %)
平成26年(CY2014)
前年比 ※1
括弧内は寄与度※2
速報値 ※4
Preliminary
国内総生産(GDP)
民間最終消費支出
家計最終消費支出
除く持ち家の帰属家賃
民間住宅
寄与度(対GDP) ※3
第二次
第一次
第一次
速報値 ※4
速報値 ※4
年次推計値
年次推計値
年次推計値
Revised
Preliminary
Revised
Preliminary
Revised
***
***
0.3
0.6
1.2
0.0
0.4
0.1
0.7
0.1
0.7
Domestic Demand
-0.1
0.3
0.1
0.7
0.0
0.5
Private Demand
-0.9
-0.9
-1.2
-0.4
-0.7
-0.2
Private Consumption
-0.8
-0.8
-1.2
-0.5
-0.7
-0.3
-1.2
-1.2
-1.7
-0.9
-0.8
-0.4
-5.3
-4.3
-2.5
-1.6
-0.1
-0.1
3.1
5.2
1.6
1.2
0.2
0.2
0.6
0.6
Consumption of
Households
Excluding Imputed
Rent
Private Residential
Investment
Private Non-Resi.
Investment
Change in Private
Inventories
民間企業設備
民間在庫変動
前年比 ※1
-0.0
国内需要
民間需要
平成27年(CY2015)
(0.2)
(0.1)
***
***
Gross Domestic Product
0.3
0.7
0.4
0.8
0.1
0.2
Public Demand
政府最終消費支出
0.1
0.5
1.2
1.6
0.2
0.3
Government Consumption
公的固定資本形成
0.4
0.7
-2.5
-2.2
-0.1
-0.1
Public Investment
-0.0
-0.0
Change in Public Inventories
0.0
0.0
(Regrouped) Gross Fixed Capital
Formation
0.4
0.5
Net Exports of Goods & Services
Exports of Goods & Services
公的需要
公的在庫変動
(0.0)
1.3
(再掲)総固定資本形成
財貨・サービスの純輸出
(0.0)
( -0.0)
***
2.9
( -0.0)
***
0.1
***
0.1
***
財貨・サービスの輸出
8.3
9.3
2.8
3.0
0.5
0.5
財貨・サービスの輸入(控除)
7.2
8.3
0.4
0.1
-0.1
-0.0
(Less) Imports of Goods &
Services
(参考)
最終需要
(cf)
***
0.2
***
0.6
***
***
Final Sales of Domestic Product
国内総所得(GDI)
-0.5
0.2
2.0
2.7
***
***
Gross Domestic Income
国民総所得(GNI)
-0.2
0.5
2.5
2.8
***
***
Gross National Income
GDPデフレーター
1.7
1.7
2.0
2.0
***
***
GDP Deflator
国内需要デフレーター
1.9
1.9
0.3
0.4
***
***
Domestic Demand Deflator
※1: Changes from the previous year
※2: Contributions to changes in GDP in parentheses
※3: Contributions to changes in GDP
※4: 平成28年7-9月期四半期別GDP1次速報(平成17暦年連鎖価格)
Quarterly Estimates of GDP for July-September 2016 (First Preliminary Estimates, Chained (2005) Yen)
6.速報値と年次推計値の比較(実質値・実数、暦年)
Comparison of the Preliminary and the Revised Estimates (Level in Real, Calendar Year)
(平成23暦年連鎖価格、単位:10億円)
(Billions of Chained (2011) Yen)
平成26年(CY2014)
平成27年(CY2015)
速報値 ※1
第二次
年次推計値
速報値 ※1
第一次
年次推計値
Preliminary
Revised
Preliminary
Revised
国内総生産(GDP)
526,117.2
510,489.2
529,120.2
516,714.3
Gross Domestic Product
国内需要
518,123.6
519,525.0
518,847.9
523,142.1
Domestic Demand
393,824.2
390,134.9
394,048.4
392,728.2
Private Demand
310,478.3
296,435.1
306,839.2
295,224.2
Private Consumption
302,868.2
289,410.1
299,166.8
287,883.0
251,377.6
238,005.1
247,164.5
235,883.2
民間住宅
13,733.6
15,202.2
13,387.8
14,951.6
Consumption of
Households
Excluding Imputed
Rent
Private Residential
Investment
民間企業設備
71,001.0
78,762.9
72,120.1
79,714.8
Private Non-Resi. Investment
民間在庫変動
-940.5
-308.6
1,892.0
2,790.2
Change in Private Inventories
124,224.5
129,390.3
124,710.8
130,414.4
Public Demand
政府最終消費支出
102,162.9
102,930.0
103,340.4
104,627.7
Government Consumption
公的固定資本形成
22,050.4
26,374.2
21,493.6
25,802.1
49.1
72.3
1.6
-1.3
(再掲)総固定資本形成
106,772.4
120,318.5
106,871.8
120,426.0
(Regrouped) Gross Fixed Capital
Formation
財貨・サービスの純輸出
9,580.9
-8,892.0
11,839.6
-6,561.6
Net Exports of Goods & Services
財貨・サービスの輸出
90,116.2
80,695.2
92,666.4
83,139.9
Exports of Goods & Services
財貨・サービスの輸入(控除)
80,535.4
89,587.3
80,826.8
89,701.5
(Less) Imports of Goods &
Services
民間需要
民間最終消費支出
家計最終消費支出
除く持ち家の帰属家賃
公的需要
公的在庫変動
Public Investment
Change in Public Inventories
(参考)
(cf)
最終需要
***
510,688.1
***
513,859.4
Final Sales of Domestic Product
国内総所得(GDI)
502,715.1
508,184.1
512,689.9
521,714.3
Gross Domestic Income
国民総所得(GNI)
523,110.7
526,557.1
536,319.7
541,492.4
Gross National Income
GDPデフレーター
92.5
100.6
94.4
102.7
GDP Deflator
国内需要デフレーター
96.9
101.3
97.2
101.7
Domestic Demand Deflator
※1: 平成28年7-9月期四半期別GDP1次速報(平成17暦年連鎖価格)
Quarterly Estimates of GDP for July-September 2016 (First Preliminary Estimates, Chained (2005) Yen)
7.速報値と年次推計値の比較(名目成長率、暦年)
Comparison of the Preliminary and the Revised Estimates (Annual Nominal Growth Rate, Calendar Year)
(単位:%)
(%)
平成26年(CY2014)
前年比 ※1
括弧内は寄与度※2
速報値 ※4
Preliminary
平成27年(CY2015)
前年比 ※1
寄与度(対GDP) ※3
第二次
第一次
第一次
速報値 ※4
速報値 ※4
年次推計値
年次推計値
年次推計値
Revised
Preliminary
Revised
Preliminary
Revised
***
***
国内総生産(GDP)
1.6
2.1
2.5
3.3
国内需要
1.9
2.2
0.4
1.1
0.4
1.1
Domestic Demand
1.8
2.2
0.3
1.1
0.2
0.9
Private Demand
1.1
1.2
-1.0
-0.0
-0.6
-0.0
Private Consumption
1.2
1.3
-1.0
-0.1
-0.6
-0.1
1.4
1.5
-1.3
-0.2
-0.6
-0.1
-2.0
-0.9
-1.7
-0.7
-0.1
-0.0
4.5
6.4
2.5
2.1
0.4
0.3
0.5
0.6
Consumption of
Households
Excluding Imputed
Rent
Private Residential
Investment
Private Non-Resi.
Investment
Change in Private
Inventories
民間需要
民間最終消費支出
家計最終消費支出
除く持ち家の帰属家賃
民間住宅
民間企業設備
民間在庫変動
(0.2)
(0.1)
***
***
Gross Domestic Product
2.2
2.4
0.7
1.1
0.2
0.3
Public Demand
政府最終消費支出
1.8
2.1
1.4
1.7
0.3
0.3
Government Consumption
公的固定資本形成
3.4
3.4
-1.6
-0.8
-0.1
-0.0
Public Investment
-0.0
-0.0
Change in Public Inventories
0.2
0.3
(Regrouped) Gross Fixed Capital
Formation
2.1
2.1
Net Exports of Goods & Services
公的需要
公的在庫変動
(0.0)
3.3
(再掲)総固定資本形成
財貨・サービスの純輸出
(0.0)
( -0.3)
***
4.7
( -0.2)
***
1.0
***
1.1
***
財貨・サービスの輸出
11.4
12.6
3.4
3.8
0.6
0.7
Exports of Goods & Services
財貨・サービスの輸入(控除)
11.4
12.1
-7.3
-7.3
1.5
1.5
(Less) Imports of Goods &
Services
(参考)
最終需要
国民総所得(GNI)
(cf)
***
2.0
2.0
2.3
***
3.1
2.7
***
***
Final Sales of Domestic Product
3.4
***
***
Gross Domestic Income
※1: Changes from the previous year
※2: Contributions to changes in GDP in parentheses
※3: Contributions to changes in GDP
※4: 平成28年7-9月期四半期別GDP1次速報
Quarterly Estimates of GDP for July-September 2016 (First Preliminary Estimates)
8.速報値と年次推計値の比較(名目値・実数、暦年)
Comparison of the Preliminary and the Revised Estimates (Level in Nominal, Calendar Year)
(単位:10億円)
(Billion Yen)
平成26年(CY2014)
平成27年(CY2015)
速報値 ※1
第二次
年次推計値
速報値 ※1
第一次
年次推計値
Preliminary
Revised
Preliminary
Revised
国内総生産(GDP)
486,871.2
513,698.0
499,280.7
530,545.2
Gross Domestic Product
国内需要
502,088.1
526,365.9
504,146.2
532,258.9
Domestic Demand
377,753.7
395,479.0
378,889.6
399,875.1
Private Demand
295,395.3
300,117.5
292,451.9
300,081.6
Private Consumption
288,215.5
293,112.5
285,217.8
292,713.9
241,587.6
243,337.3
238,557.2
242,862.5
民間住宅
14,967.5
15,959.0
14,713.3
15,842.5
Consumption of
Households
Excluding Imputed
Rent
Private Residential
Investment
民間企業設備
68,361.8
79,736.6
70,089.8
81,429.2
Private Non-Resi. Investment
民間在庫変動
-970.9
-334.2
1,634.7
2,521.9
Change in Private Inventories
124,334.4
130,886.9
125,256.6
132,383.8
Public Demand
政府最終消費支出
100,452.5
103,561.0
101,812.5
105,335.3
Government Consumption
公的固定資本形成
23,798.9
27,241.2
23,415.6
27,034.1
82.9
84.8
28.5
14.4
(再掲)総固定資本形成
107,128.2
122,936.8
108,218.6
124,305.7
(Regrouped) Gross Fixed Capital
Formation
財貨・サービスの純輸出
-15,216.9
-12,667.9
-4,865.5
-1,713.7
Net Exports of Goods & Services
財貨・サービスの輸出
86,390.3
90,135.4
89,340.8
93,566.3
Exports of Goods & Services
101,607.2
102,803.3
94,206.3
95,280.0
(Less) Imports of Goods &
Services
民間需要
民間最終消費支出
家計最終消費支出
除く持ち家の帰属家賃
公的需要
公的在庫変動
財貨・サービスの輸入(控除)
Public Investment
Change in Public Inventories
(参考)
(cf)
最終需要
***
513,947.4
***
528,008.9
Final Sales of Domestic Product
国民総所得(GNI)
506,607.3
532,278.9
522,196.0
550,623.6
Gross Domestic Income
※1: 平成28年7-9月期四半期別GDP1次速報
Quarterly Estimates of GDP for July-September 2016 (First Preliminary Estimates)
9.雇用者報酬
Compensation of Employees
(1)速報値と年次推計値の比較(名目値、前年度比)
Comparison of the Preliminary and the Revised Estimates (Annual Nominal Growth Rate, Fiscal Year)
(単位:%)
(%)
平成26年度(FY2014)
雇用者報酬
平成27年度(FY2015)
速報値 ※1
第二次
年次推計値
速報値 ※1
第一次
年次推計値
Preliminary
Revised
Preliminary
Revised
1.9
1.8
1.7
1.5
Compensation of Employees
(2)速報値と年次推計値の比較(名目値・実数、年度)
Comparison of the Preliminary and the Revised Estimates (Level in Nominal, Fiscal Year)
(単位:10億円)
(Billion Yen)
平成26年度(FY2014)
雇用者報酬
平成27年度(FY2015)
速報値 ※1
第二次
年次推計値
速報値 ※1
第一次
年次推計値
Preliminary
Revised
Preliminary
Revised
252,491.6
259,505.2
256,850.6
263,420.4
Compensation of Employees
(3)速報値と年次推計値の比較(名目値、前暦年比)
Comparison of the Preliminary and the Revised Estimates (Annual Nominal Growth Rate, Calendar Year)
(単位:%)
(%)
平成26年(CY2014)
雇用者報酬
平成27年(CY2015)
速報値 ※1
第二次
年次推計値
速報値 ※1
第一次
年次推計値
Preliminary
Revised
Preliminary
Revised
1.6
1.6
1.6
1.3
Compensation of Employees
(4)速報値と年次推計値の比較(名目値・実数、暦年)
Comparison of the Preliminary and the Revised Estimates (Level in Nominal, Calendar Year)
(単位:10億円)
(Billion Yen)
平成26年(CY2014)
雇用者報酬
平成27年(CY2015)
速報値 ※1
第二次
年次推計値
速報値 ※1
第一次
年次推計値
Preliminary
Revised
Preliminary
Revised
251,538.3
258,546.9
255,486.6
※1: 平成28年7-9月期四半期別GDP1次速報
Quarterly Estimates of GDP for July-September 2016 (First Preliminary Estimates)
261,947.6
Compensation of Employees
Ⅱ.平成23年基準改定値(支出側系列等)の推移
Time Series After Benchmark Year Revision of 2011 (GDP etc.)
1.実質GDPの改定状況
Revisions to Real GDP
(1)実質GDP成長率(前年度比)
Revisions to Annual Real GDP Growth Rate (Fiscal Year)
(%)
(前年度比、単位:%)
4.0
3.0
2.0
1.0
0.0
-1.0
-2.0
-3.0
平成23年基準
(Benchmark Year: 2011)
-4.0
平成17年基準
(Benchmark Year: 2005)
-5.0
'95 '96 '97 '98 '99 '00 '01 '02 '03 '04 '05 '06 '07 '08 '09 '10 '11 '12 '13 '14 '15
(%)
(前年度比、単位:%)
年度(平成) 7年 8年 9年 10年 11年 12年 13年 14年 15年 16年 17年 18年 19年 20年 21年 22年 23年 24年 25年 26年 27年
Fiscal Year
平成23年基準
(Benchmark Year: 2011)
平成17年基準
(Benchmark Year: 2005)
差
(Differences)
1995 1996 1997 1998 1999 2000 2001 2002 2003 2004 2005 2006 2007 2008 2009 2010 2011 2012 2013 2014 2015
3.5 2.7 0.0 -0.8 0.7 2.5 -0.6 0.9 2.1 1.5 2.1 1.4 1.2 -3.5 -2.2 3.2 0.5 0.9 2.6 -0.4 1.3
2.7 2.7 0.1 -1.5 0.5 2.0 -0.4 1.1 2.3 1.5 1.9 1.8 1.8 -3.7 -2.0 3.5 0.4 0.9 2.0 -0.9 0.9
0.8 0.1 -0.1 0.7 0.1 0.5 -0.2 -0.2 -0.2 0.1 0.2 -0.3 -0.7 0.3 -0.1 -0.3 0.1 -0.0 0.6 0.5 0.5
(2)実質GDP及び各需要項目の伸び率(前年度比)の改定状況
Revisions to Annual Growth Rate of Real GDP and Its Components (Fiscal Year)
(前年度比、単位:%)
年度(平成) 18年
Fiscal Year 2006
国内総生産(GDP)
民間最終消費支出
(%)
19年
2007
20年
2008
21年
2009
22年
2010
23年
2011
24年
2012
25年
2013
26年
2014
27年
2015
新
1.4
1.2
-3.5
-2.2
3.2
0.5
0.9
2.6
-0.4
1.3
旧
1.8
1.8
-3.7
-2.0
3.5
0.4
0.9
2.0
-0.9
0.9
差
-0.3
-0.7
0.3
-0.1
-0.3
0.1
-0.0
0.6
0.5
0.5
新
0.7
0.8
-2.1
1.0
1.3
0.8
1.8
2.7
-2.7
0.5
旧
0.8
0.8
-2.0
1.2
1.6
1.4
1.7
2.3
-2.9
-0.1
差
-0.1
-0.0
-0.0
-0.3
-0.3
-0.7
0.1
0.4
0.2
0.7
新
0.3 -14.1
-1.5 -20.3
2.5
2.9
5.1
8.3
-9.9
2.7
旧
0.1 -14.5
-1.1 -21.0
2.2
3.2
5.7
8.8 -11.7
2.4
差
0.3
0.4
-0.3
0.7
0.3
-0.3
-0.6
-0.5
1.8
0.3
新
2.6
-0.7
-6.0 -11.9
2.3
4.2
2.4
7.0
2.5
0.6
旧
5.9
3.0
-7.7 -12.0
3.8
4.8
0.9
3.0
0.1
2.1
差
-3.3
-3.7
1.7
0.1
-1.5
-0.6
1.4
4.0
2.4
-1.5
新
0.4
1.3
-0.6
2.8
2.1
1.7
1.3
1.7
0.4
2.0
旧
0.4
1.2
-0.4
2.7
2.0
1.2
1.5
1.6
0.1
1.6
差
-0.0
0.1
-0.1
0.1
0.1
0.5
-0.2
0.1
0.3
0.5
新
-6.4
-4.2
-4.1
9.4
-7.1
-1.9
1.3
8.6
-2.1
-2.0
旧
-7.3
-4.9
-6.7
11.5
-6.4
-3.2
1.0
10.3
-2.6
-2.7
差
0.9
0.7
2.5
-2.1
-0.7
1.3
0.2
-1.7
0.5
0.7
財貨・サービスの輸出 新
8.7
9.5 -10.2
-9.0
17.9
-1.6
-1.6
4.4
8.7
0.8
旧
8.7
9.4 -10.6
-9.6
17.5
-1.6
-1.4
4.4
7.9
0.4
差
-0.0
0.1
0.6
0.4
0.0
-0.2
0.0
0.8
0.4
財貨・サービスの輸入 新
3.6
2.4
-4.4 -10.7
12.1
5.2
3.8
7.1
4.1
-0.2
(控除)
旧
3.8
2.4
-4.7 -10.7
12.0
5.4
3.6
6.8
3.4
0.0
差
-0.2
0.1
0.1
-0.2
0.2
0.4
0.7
-0.2
民間住宅
民間企業設備
政府最終消費支出
公的固定資本形成
0.4
0.4
0.0
Gross Domestic Product
Private Consumption
Private Residential
Investment
Private Non-Resi.
Investment
Government
Consumption
Public Investment
Exports of Goods &
Services
(Less) Imports of Goods
& Services
※: 各項目の上段(新)は平成23年基準、中段(旧)は平成17年基準の計数を示す。
In each item, the top line contains the estimates after the revision (benchmark year: 2011), the middle line contains the
estimates before the revision (benchmark year: 2005), and the bottom line presents the difference between the top and
the middle line.
(3)実質GDP成長率に対する需要項目別寄与度の改定状況
Revisions to Contributions to Annual Real GDP Growth Rate (Fiscal Year)
(前年度比、単位:%)
年度(平成) 18年
Fiscal Year 2006
(%)
19年
2007
20年
2008
21年
2009
22年
2010
23年
2011
24年
2012
25年
2013
26年
2014
27年
2015
新
1.4
1.2
-3.5
-2.2
3.2
0.5
0.9
2.6
-0.4
1.3
旧
1.8
1.8
-3.7
-2.0
3.5
0.4
0.9
2.0
-0.9
0.9
差
-0.3
-0.7
0.3
-0.1
-0.3
0.1
-0.0
0.6
0.5
0.5
新
0.4
0.4
-1.1
0.5
0.7
0.4
1.1
1.6
-1.6
0.3
旧
0.5
0.5
-1.1
0.7
0.9
0.8
1.0
1.4
-1.7
-0.1
差
-0.1
-0.0
0.0
-0.2
-0.2
-0.4
0.0
0.2
0.2
0.4
新
0.0
-0.5
-0.0
-0.7
0.1
0.1
0.1
0.3
-0.3
0.1
旧
0.0
-0.5
-0.0
-0.7
0.1
0.1
0.2
0.3
-0.4
0.1
差
0.0
0.0
-0.0
0.0
0.0
-0.0
-0.0
-0.0
0.1
0.0
新
0.4
-0.1
-0.9
-1.8
0.3
0.6
0.3
1.0
0.4
0.1
旧
0.8
0.4
-1.1
-1.7
0.5
0.6
0.1
0.4
0.0
0.3
差
-0.4
-0.5
0.2
-0.1
-0.2
-0.0
0.2
0.6
0.4
-0.2
新
0.1
0.2
0.1
-1.4
1.2
0.0
-0.1
-0.5
0.5
0.4
旧
-0.1
0.2
0.0
-1.5
1.1
-0.3
0.1
-0.3
0.6
0.3
差
0.1
-0.1
0.1
0.0
0.1
0.3
-0.2
-0.1
-0.2
0.0
新
0.1
0.2
-0.1
0.5
0.4
0.3
0.3
0.4
0.1
0.4
旧
0.1
0.2
-0.1
0.5
0.4
0.2
0.3
0.3
0.0
0.3
差
-0.0
0.0
-0.0
0.0
0.0
0.1
-0.0
0.0
0.1
0.1
新
-0.3
-0.2
-0.2
0.5
-0.4
-0.1
0.1
0.4
-0.1
-0.1
旧
-0.3
-0.2
-0.3
0.5
-0.3
-0.1
0.0
0.5
-0.1
-0.1
差
0.0
0.0
0.1
-0.0
-0.1
0.0
0.0
-0.0
0.0
0.0
新
-0.0
0.0
-0.0
0.0
-0.0
0.0
0.0
0.0
0.0
-0.0
旧
-0.0
0.0
0.0
-0.0
-0.0
0.0
-0.0
0.0
0.0
-0.0
差
-0.0
0.0
-0.0
0.0
-0.0
-0.0
0.0
-0.0
-0.0
0.0
財貨・サービスの輸出 新
1.3
1.5
-1.8
-1.4
2.4
-0.2
-0.2
0.7
1.4
0.1
旧
1.3
1.6
-1.9
-1.5
2.4
-0.2
-0.2
0.7
1.3
0.1
差
-0.0
-0.0
0.1
0.1
0.0
0.0
-0.0
-0.0
0.1
0.1
財貨・サービスの輸入 新
-0.5
-0.4
0.7
1.7
-1.5
-0.7
-0.6
-1.2
-0.8
0.0
(控除)
旧
-0.5
-0.4
0.8
1.7
-1.5
-0.8
-0.6
-1.2
-0.7
-0.0
差
0.0
-0.0
-0.1
-0.1
0.0
0.1
-0.0
-0.0
-0.1
0.0
国内総生産(GDP)
民間最終消費支出
民間住宅
民間企業設備
民間在庫変動
政府最終消費支出
公的固定資本形成
公的在庫変動
Gross Domestic Product
Private Consumption
Private Residential
Investment
Private Non-Resi.
Investment
Change in Private
Inventories
Government
Consumption
Public Investment
Change in Public
Inventories
Exports of Goods &
Services
(Less) Imports of
Goods & Services
※: 各項目の上段(新)は平成23年基準、中段(旧)は平成17年基準の計数を示す。
In each item, the top line contains the estimates after the revision (benchmark year: 2011), the middle line contains
the estimates before the revision (benchmark year: 2005), and the bottom line presents the difference between the top
and the middle line.
2.名目GDPの改定状況
Revisions to Nominal GDP
(1)名目GDP成長率(前年度比)
Revisions to Annual Nominal GDP Growth Rate (Fiscal Year)
4.0
(前年度比、単位:%)
(%)
2.0
0.0
-2.0
-4.0
平成23年基準
(Benchmark Year: 2011)
平成17年基準
(Benchmark Year: 2005)
-6.0
'95
'96
'97
'98
'99
'00
'01
'02
'03
'04
'05
'06
'07
'08
'09
'10
'11
'12
'13
'14
'15
(%)
(前年度比、単位:%)
年度(平成) 6年 7年 8年 9年 10年 11年 12年 13年 14年 15年 16年 17年 18年 19年 20年 21年 22年 23年 24年 25年 26年 27年
Fiscal Year 1994 1995 1996 1997 1998 1999 2000 2001 2002 2003 2004 2005 2006 2007 2008 2009 2010 2011 2012 2013 2014 2015
平成23年基準
(Benchmark Year: 2011)
平成17年基準
(Benchmark Year: 2005)
差
(Differences)
***
2.9
2.3
0.8 -1.3 -0.8
1.3 -1.8 -0.8
0.7
0.5
0.9
0.7
0.3 -4.1 -3.4
1.4 -1.1
0.2
2.6
2.1
2.8
***
1.8
2.2
1.0 -2.0 -0.8
0.8 -1.8 -0.7
0.8
0.2
0.5
0.7
0.8 -4.6 -3.2
1.4 -1.3
0.0
1.7
1.5
2.3
***
1.0
0.1 -0.2
0.4 -0.1 -0.1 -0.1
0.4
0.4 -0.1 -0.4
0.1
0.1
0.9
0.6
0.5
0.7
0.1
0.5 -0.2
0.3
(2)名目GDP(実額)(年度)
Revisions to Nominal GDP (Fiscal Year)
540.0
(Trillion Yen)
(兆円)
530.0
520.0
510.0
500.0
490.0
平成23年基準
(Benchmark Year: 2011)
480.0
平成17年基準
(Benchmark Year: 2005)
470.0
'95
'96
'97
'98
'99
'00
'01
'02
'03
'04
'05
'06
'07
'08
'09
'10
'11
'12
'13
'14
'15
(Trillion Yen)
(兆円)
年度(平成) 6年 7年 8年 9年 10年 11年 12年 13年 14年 15年 16年 17年 18年 19年 20年 21年 22年 23年 24年 25年 26年 27年
Fiscal Year 1994 1995 1996 1997 1998 1999 2000 2001 2002 2003 2004 2005 2006 2007 2008 2009 2010 2011 2012 2013 2014 2015
平成23年基準
(Benchmark Year: 2011)
平成17年基準
(Benchmark Year: 2005)
差
(Differences)
502.4 516.7 528.7 533.1 526.1 522.0 528.6 518.9 514.7 518.2 521.0 525.8 529.3 531.0 509.4 492.1 499.2 493.9 494.7 507.4 517.9 532.2
495.6 504.6 515.9 521.3 510.9 506.6 510.8 501.7 498.0 501.9 502.8 505.3 509.1 513.0 489.5 474.0 480.5 474.2 474.4 482.4 489.6 500.6
6.8 12.1 12.7 11.9 15.2 15.4 17.8 17.2 16.7 16.3 18.2 20.5 20.1 18.0 19.9 18.1 18.7 19.7 20.3 25.0 28.3 31.6
(3)名目GDP及び各需要項目の伸び率(前年度比)の改定状況
Revisions to Annual Growth Rate of Nominal GDP and Its Components (Fiscal Year)
(前年度比、単位:%)
年度(平成) 18年
Fiscal Year 2006
(%)
19年
2007
20年
2008
21年
2009
22年
2010
23年
2011
24年
2012
25年
2013
26年
2014
27年
2015
新
0.7
0.3
-4.1
-3.4
1.4
-1.1
0.2
2.6
2.1
2.8
旧
0.7
0.8
-4.6
-3.2
1.4
-1.3
0.0
1.7
1.5
2.3
差
-0.1
-0.4
0.5
-0.2
0.1
0.3
0.1
0.9
0.6
0.5
新
0.6
0.7
-1.9
-1.4
0.1
0.3
0.9
3.0
-0.5
0.5
旧
0.3
0.5
-2.2
-1.4
0.1
0.7
0.7
2.5
-0.8
-0.4
差
0.2
0.3
0.4
-0.1
-0.0
-0.3
0.3
0.5
0.3
0.9
新
2.2 -12.5
0.7 -22.7
2.4
3.1
4.4
11.5
-6.7
2.7
旧
2.1 -12.9
1.1 -23.5
2.3
3.7
5.1
12.0
-8.5
2.2
差
0.1
0.4
0.8
0.0
-0.6
-0.7
-0.5
1.9
0.4
新
2.6
-0.7
-6.1 -14.5
1.2
3.3
2.0
7.8
3.8
1.1
旧
5.7
2.9
-7.6 -14.5
2.0
3.8
0.7
3.9
1.5
2.5
差
-3.1
-3.6
1.5
-0.0
-0.8
-0.5
1.2
3.8
2.2
-1.4
新
-0.5
1.5
-0.6
1.3
1.7
1.6
0.6
1.5
2.4
1.7
旧
-0.5
1.4
-0.4
1.4
1.4
1.2
0.8
1.4
2.2
1.3
差
0.1
0.0
-0.2
-0.2
0.3
0.5
-0.2
0.1
0.2
0.4
新
-5.2
-2.8
-2.3
5.8
-7.2
-1.9
0.8
10.2
0.8
-1.4
旧
-6.0
-3.0
-4.0
7.7
-6.5
-2.6
0.8
12.4
0.4
-2.6
差
0.8
0.3
1.7
-1.9
-0.7
0.6
0.1
-2.2
0.4
1.2
財貨・サービスの輸出 新
12.0
10.0 -14.8 -17.7
14.7
-3.7
-0.8
14.1
11.5
-0.7
旧
11.9
10.0 -15.0 -17.9
14.8
-3.9
-0.9
13.3
10.5
-1.1
差
0.1
0.0
0.1
-0.0
0.2
0.1
0.9
1.0
0.4
財貨・サービスの輸入 新
12.3
9.6
-4.9 -24.9
15.3
11.0
4.6
18.9
4.5
-9.2
(控除)
旧
12.3
9.7
-4.9 -25.0
15.5
11.2
4.5
18.8
4.0
-9.3
差
-0.0
-0.0
-0.1
-0.2
0.1
0.1
0.5
0.0
国内総生産(GDP)
民間最終消費支出
民間住宅
民間企業設備
政府最終消費支出
公的固定資本形成
-0.3
0.2
0.0
0.1
Gross Domestic Product
Private Consumption
Private Residential
Investment
Private Non-Resi.
Investment
Government
Consumption
Public Investment
Exports of Goods &
Services
(Less) Imports of Goods
& Services
※: 各項目の上段(新)は平成23年基準、中段(旧)は平成17年基準の計数を示す。
In each item, the top line contains the estimates after the revision (benchmark year: 2011), the middle line contains the
estimates before the revision (benchmark year: 2005), and the bottom line presents the difference between the top and
the middle line.
(4)名目GDP成長率に対する需要項目別寄与度の改定状況
Revisions to Contributions to Annual Nominal GDP Growth Rate (Fiscal Year)
(前年度比、単位:%)
年度(平成) 18年
Fiscal Year 2006
(%)
19年
2007
20年
2008
21年
2009
22年
2010
23年
2011
24年
2012
25年
2013
26年
2014
27年
2015
新
0.7
0.3
-4.1
-3.4
1.4
-1.1
0.2
2.6
2.1
2.8
旧
0.7
0.8
-4.6
-3.2
1.4
-1.3
0.0
1.7
1.5
2.3
差
-0.1
-0.4
0.5
-0.2
0.1
0.3
0.1
0.9
0.6
0.5
新
0.3
0.4
-1.0
-0.8
0.1
0.2
0.6
1.8
-0.3
0.3
旧
0.2
0.3
-1.3
-0.8
0.1
0.4
0.4
1.5
-0.5
-0.2
差
0.1
0.1
0.2
-0.0
-0.0
-0.2
0.1
0.2
0.2
0.5
新
0.1
-0.5
0.0
-0.8
0.1
0.1
0.1
0.3
-0.2
0.1
旧
0.1
-0.5
0.0
-0.8
0.1
0.1
0.1
0.4
-0.3
0.1
差
0.0
0.0
-0.0
0.0
0.0
-0.0
-0.0
-0.0
0.1
0.0
新
0.4
-0.1
-1.0
-2.2
0.2
0.5
0.3
1.1
0.6
0.2
旧
0.8
0.4
-1.1
-2.1
0.3
0.5
0.1
0.5
0.2
0.3
差
-0.4
-0.5
0.2
-0.1
-0.1
-0.0
0.2
0.6
0.4
-0.2
新
0.1
0.2
-0.0
-1.2
1.2
0.1
-0.1
-0.5
0.5
0.3
旧
-0.0
0.2
-0.1
-1.3
1.0
-0.2
0.1
-0.4
0.6
0.3
差
0.1
-0.1
0.0
0.0
0.2
0.3
-0.2
-0.1
-0.2
0.0
新
-0.1
0.3
-0.1
0.2
0.3
0.3
0.1
0.3
0.5
0.3
旧
-0.1
0.3
-0.1
0.3
0.3
0.2
0.2
0.3
0.4
0.3
差
0.0
0.0
-0.0
-0.0
0.1
0.1
-0.0
0.0
0.0
0.1
新
-0.3
-0.1
-0.1
0.3
-0.4
-0.1
0.0
0.5
0.0
-0.1
旧
-0.3
-0.1
-0.2
0.3
-0.3
-0.1
0.0
0.5
0.0
-0.1
差
0.0
-0.0
0.1
-0.0
-0.1
0.0
0.0
-0.0
0.0
0.1
新
-0.0
0.0
-0.0
0.0
-0.0
0.0
-0.0
0.0
0.0
-0.0
旧
-0.0
0.0
0.0
-0.0
-0.0
0.0
-0.0
0.0
0.0
-0.0
差
-0.0
0.0
-0.0
0.0
-0.0
-0.0
0.0
-0.0
-0.0
0.0
財貨・サービスの輸出 新
1.7
1.6
-2.6
-2.8
2.0
-0.6
-0.1
2.1
1.9
-0.1
旧
1.8
1.6
-2.7
-2.9
2.0
-0.6
-0.1
2.0
1.7
-0.2
差
-0.0
-0.0
0.1
0.1
-0.0
0.0
0.0
0.1
0.1
0.1
財貨・サービスの輸入 新
-1.6
-1.4
0.8
4.0
-1.9
-1.5
-0.7
-3.1
-0.9
1.8
(控除)
旧
-1.7
-1.5
0.8
4.1
-2.0
-1.6
-0.7
-3.2
-0.8
1.9
差
0.1
0.0
-0.0
-0.1
0.1
0.1
0.0
0.1
-0.1
-0.1
国内総生産(GDP)
民間最終消費支出
民間住宅
民間企業設備
民間在庫変動
政府最終消費支出
公的固定資本形成
公的在庫変動
Gross Domestic Product
Private Consumption
Private Residential
Investment
Private Non-Resi.
Investment
Change in Private
Inventories
Government
Consumption
Public Investment
Change in Public
Inventories
Exports of Goods &
Services
(Less) Imports of Goods
& Services
※: 各項目の上段(新)は平成23年基準、中段(旧)は平成17年基準の計数を示す。
In each item, the top line contains the estimates after the revision (benchmark year: 2011), the middle line contains the
estimates before the revision (benchmark year: 2005), and the bottom line presents the difference between the top and
the middle line.
(5)名目GDP及び各需要項目の改定状況
Revisions to Nominal GDP and Its Components (Fiscal Year)
(実額、単位:兆円)
年度(平成) 18年
Fiscal Year 2006
国内総生産(GDP)
20年
2008
21年
2009
22年
2010
23年
2011
24年
2012
25年
2013
26年
2014
27年
2015
新
529.3 531.0 509.4 492.1 499.2 493.9 494.7 507.4 517.9 532.2
旧
509.1 513.0 489.5 474.0 480.5 474.2 474.4 482.4 489.6 500.6
差
民間最終消費支出
(Trillion Yen)
19年
2007
20.1
18.0
19.9
18.1
18.7
19.7
20.3
25.0
28.3
31.6
新
294.7 296.9 291.4 287.2 287.4 288.4 291.2 300.0 298.4 299.9
旧
293.4 294.7 288.1 284.2 284.5 286.4 288.4 295.7 293.2 292.0
差
1.4
2.2
3.3
3.0
3.0
2.0
2.8
4.3
5.2
7.9
新
19.9
17.4
17.5
13.5
13.9
14.3
14.9
16.6
15.5
15.9
旧
18.8
16.4
16.5
12.6
12.9
13.4
14.1
15.8
14.4
14.8
差
1.1
1.1
1.0
0.9
0.9
0.9
0.8
0.8
1.1
1.2
新
84.5
83.9
78.8
67.4
68.2
70.4
71.8
77.4
80.3
81.2
旧
74.7
76.8
71.0
60.7
61.9
64.3
64.8
67.4
68.4
70.1
差
9.8
7.1
7.8
6.6
6.2
6.1
7.0
10.1
12.0
11.1
新
0.9
1.7
1.7
-4.7
1.0
1.4
0.7
-1.6
0.8
2.4
旧
0.5
1.7
1.3
-5.0
-0.3
-1.4
-1.1
-2.8
0.2
1.6
差
0.5
0.1
0.3
0.3
1.3
2.8
1.8
1.2
0.6
0.8
新
94.5
95.9
95.3
96.6
98.2
99.7 100.4 101.8 104.3 106.0
旧
91.9
93.3
92.9
94.2
95.5
96.6
97.5
差
2.6
2.6
2.4
2.3
2.6
3.1
2.9
3.0
3.3
3.8
新
26.4
25.7
25.1
26.6
24.7
24.2
24.4
26.9
27.1
26.7
旧
22.8
22.1
21.2
22.8
21.3
20.8
21.0
23.6
23.7
23.0
差
3.7
3.6
3.9
3.7
3.3
3.4
3.4
3.3
3.4
3.7
新
-0.0
0.1
-0.0
0.0
-0.1
0.0
0.0
0.0
0.1
0.0
旧
-0.0
0.1
0.1
-0.0
-0.1
0.1
-0.0
0.0
0.1
0.0
差
-0.0
0.0
-0.1
0.1
0.0
-0.0
0.1
0.0
-0.0
-0.0
財貨・サービスの輸出 新
85.8
94.4
80.4
66.2
75.9
73.1
72.5
82.8
92.3
91.7
旧
84.1
92.4
78.6
64.6
74.1
71.2
70.6
80.0
88.4
87.4
差
1.7
1.9
1.8
1.6
1.8
1.9
1.9
2.8
3.9
4.3
財貨・サービスの輸入 新
77.5
85.0
80.8
60.7
70.0
77.7
81.3
96.6 100.9
91.6
(控除)
旧
76.9
84.4
80.2
60.2
69.5
77.3
80.8
95.9
99.8
90.5
差
0.6
0.6
0.6
0.5
0.5
0.4
0.5
0.7
1.2
1.1
民間住宅
民間企業設備
民間在庫変動
政府最終消費支出
公的固定資本形成
公的在庫変動
Gross Domestic Product
Private Consumption
Private Residential
Investment
Private Non-Resi.
Investment
Change in Private
Inventories
Government
Consumption
98.8 101.0 102.3
Public Investment
Change in Public
Inventories
Exports of Goods &
Services
(Less) Imports of
Goods & Services
※: 各項目の上段(新)は平成23年基準、中段(旧)は平成17年基準の計数を示す。
In each item, the top line contains the estimates after the revision (benchmark year: 2011), the middle line contains the
estimates before the revision (benchmark year: 2005), and the bottom line presents the difference between the top and
the middle line.
3.GDPデフレーターの改定状況
Revisions to GDP Deflator
(1)GDPデフレーター上昇率(前年度比)の改定状況
Revisions to Annual Percent Change in GDP Deflator
(%)
(前年度比、単位:%)
3.0
2.5
2.0
平成23年基準
(Benchmark Year: 2011)
1.5
平成17年基準
(Benchmark Year: 2005)
1.0
0.5
0.0
-0.5
-1.0
-1.5
-2.0
-2.5
'95 '96 '97 '98 '99 '00 '01 '02 '03 '04 '05 '06 '07 '08 '09 '10 '11 '12 '13 '14 '15
(%)
(前年度比、単位:%)
年度(平成) 7年 8年 9年 10年 11年 12年 13年 14年 15年 16年 17年 18年 19年 20年 21年 22年 23年 24年 25年 26年 27年
Fiscal Year
平成23年基準
(Benchmark Year: 2011)
平成17年基準
(Benchmark Year: 2005)
差
(Differences)
1995 1996 1997 1998 1999 2000 2001 2002 2003 2004 2005 2006 2007 2008 2009 2010 2011 2012 2013 2014 2015
-0.6 -0.4 0.8 -0.5 -1.5 -1.2 -1.2 -1.7 -1.4 -1.0 -1.1 -0.7 -0.8 -0.6 -1.3 -1.7 -1.5 -0.8 -0.0 2.5 1.4
-0.8 -0.4 0.9 -0.5 -1.4 -1.1 -1.4 -1.8 -1.5 -1.3 -1.3 -1.0 -1.0 -0.9 -1.2 -2.0 -1.7 -0.9 -0.3 2.5 1.4
0.2 -0.0 -0.1 0.0 -0.1 -0.1 0.1 0.1 0.1 0.3 0.2 0.2 0.2 0.2 -0.1 0.3 0.2 0.1 0.2 0.1 0.0
(2)GDPデフレーター及び各項目の伸び率(前年度比)の改定状況
Revisions to Annual Percent Change in GDP Deflator and its Components (Fiscal Year)
(前年比、単位:%)
年度(平成) 18年
Fiscal Year 2006
(%)
19年
2007
20年
2008
21年
2009
22年
2010
23年
2011
24年
2012
25年
2013
26年
2014
27年
2015
新
-0.7
-0.8
-0.6
-1.3
-1.7
-1.5
-0.8
-0.0
2.5
1.4
旧
-1.0
-1.0
-0.9
-1.2
-2.0
-1.7
-0.9
-0.3
2.5
1.4
差
0.2
0.2
0.2
-0.1
0.3
0.2
0.1
0.2
0.1
0.0
新
-0.2
-0.1
0.2
-2.4
-1.2
-0.4
-0.8
0.3
2.2
-0.0
旧
-0.5
-0.4
-0.2
-2.6
-1.5
-0.7
-1.0
0.2
2.1
-0.3
差
0.3
0.3
0.4
0.2
0.3
0.3
0.2
0.1
0.1
0.2
新
1.9
1.8
2.2
-3.1
-0.1
0.1
-0.7
2.9
3.6
-0.0
旧
2.1
1.8
2.2
-3.2
0.2
0.5
-0.6
2.9
3.6
-0.1
差
-0.2
-0.0
-0.0
0.2
-0.3
-0.3
-0.1
0.0
0.0
0.1
新
0.0
-0.0
-0.1
-3.0
-1.1
-0.9
-0.4
0.8
1.3
0.4
旧
-0.2
-0.1
0.2
-2.8
-1.7
-0.9
-0.2
1.0
1.4
0.4
差
0.2
0.0
-0.2
-0.2
0.6
0.0
-0.2
-0.2
-0.2
0.1
新
-0.8
0.2
-0.0
-1.4
-0.5
-0.1
-0.7
-0.3
2.0
-0.3
旧
-0.9
0.2
0.0
-1.2
-0.6
-0.0
-0.7
-0.2
2.0
-0.3
差
0.1
-0.1
-0.0
-0.2
0.1
-0.1
-0.0
-0.0
-0.1
-0.1
新
1.2
1.5
2.0
-3.3
-0.1
0.0
-0.4
1.5
2.9
0.5
旧
1.3
2.0
2.9
-3.4
-0.1
0.7
-0.2
1.9
3.1
0.0
差
-0.1
-0.4
-0.9
0.1
0.0
-0.6
-0.2
-0.4
-0.1
0.5
財貨・サービスの輸出 新
3.0
0.5
-5.0
-9.6
-2.7
-2.2
0.8
9.3
2.6
-1.5
旧
3.0
0.5
-4.9
-9.1
-2.4
-2.4
0.6
8.5
2.4
-1.5
差
0.1
-0.0
-0.2
-0.5
-0.3
0.2
0.3
0.8
0.1
-0.0
財貨・サービスの輸入 新
8.4
7.0
-0.5 -16.0
2.9
5.6
0.8
11.0
0.3
-9.0
(控除)
旧
8.3
7.1
-0.2 -16.0
3.1
5.5
0.9
11.3
0.6
-9.3
差
0.1
-0.1
-0.2
0.0
-0.1
-0.3
-0.2
0.2
国内総生産(GDP)
民間最終消費支出
民間住宅
民間企業設備
政府最終消費支出
公的固定資本形成
-0.3
0.0
Gross Domestic Product
Private Consumption
Private Residential
Investment
Private Non-Resi.
Investment
Government
Consumption
Public Investment
Exports of Goods &
Services
(Less) Imports of Goods
& Services
※: 各項目の上段(新)は平成23年基準、中段(旧)は平成17年基準の計数を示す。
In each item, the top line contains the estimates after the revision (benchmark year: 2011), the middle line contains the
estimates before the revision (benchmark year: 2005), and the bottom line presents the difference between the top and
the middle line.
4.雇用者報酬(名目)の改定状況
Revisions to Compensation of Employees (Nominal, Fiscal Year)
○雇用者報酬
Compensation of Employees
年度(平成) 18年
19年
20年
21年
22年
23年
24年
25年
26年
27年
Fiscal Year 2006
2007
2008
2009
2010
2011
2012
2013
2014
2015
(前年度比、単位:%) 新
1.1
0.8
-0.1
-4.4
0.4
0.7
-0.3
0.7
1.8
1.5
(Annual Nominal Growth Rate, %) 旧
0.7
-0.0
-0.5
-4.4
0.4
0.7
0.1
0.8
1.9
1.7
差
0.4
0.9
0.4
0.0
0.0
-0.0
-0.4
-0.1
-0.1
-0.2
(実額、単位:兆円) 新 260.8
262.9 262.6 251.1 252.2 253.9 253.1 254.9 259.5 263.4
(Level in Nominal, Trillion Yen) 旧 255.7 255.6 254.3 243.0 244.0 245.6 245.9 247.9 252.5 256.9
差
5.0
7.3
8.3
8.1
8.2
8.3
7.2
7.0
7.0
6.6
※: 各項目の上段(新)は平成23年基準、中段(旧)は平成17年基準の計数を示す。
In each item, the top line contains the estimates after the revision (benchmark year: 2011), the middle line contains the
estimates before the revision (benchmark year: 2005), and the bottom line presents the difference between the top and
the middle line.
© Copyright 2026 ExpyDoc