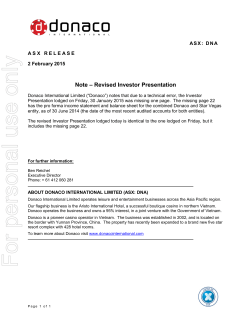
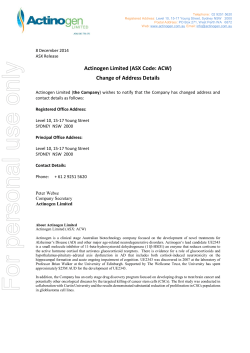
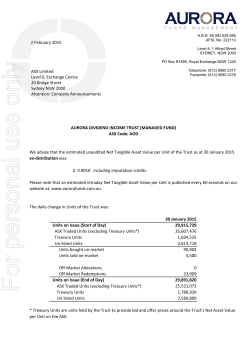
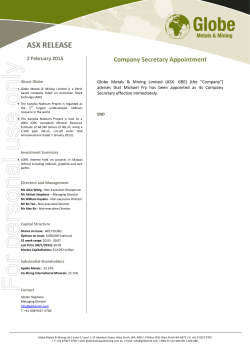
審議事項(2)-2 GW 2016-2 QUANTITATIVE STUDY ON GOODWILL AND IMPAIRMENT Staff of the European Financial Reporting Advisory Group (EFRAG) and Staff of the Accounting Standards Board of Japan (ASBJ) 財務会計基準機構のWebサイトに掲載した情報は、著作権法及び国際著作権条約をはじめ、その他の無体 財産権に関する法律並びに条約によって保護されています。許可なく複写・転載等を行うことはこれらの法 律により禁じられています。 The views expressed in this presentation are those of the presenter, not necessarily those of the European Financial Reporting Advisory Group (EFRAG), the Accounting Standard Board of Japan (ASBJ) or any individual member of the EFRAG or the ASBJ. May 2016 Copyright © 2016 European Financial Reporting Advisory Group and Accounting Standards Board of Japan. All rights reserved. 審議事項(2)-2 GW 2016-2 INDEX 1. Number of Companies Analysed & Number of Companies that Accounted for 50% of Total Goodwill in 2014 2. Evolution of Goodwill and Goodwill Impairment from 2007 to 2014 3. Trend in Average Goodwill per Company & Total Amount of Goodwill in 2014 4A. Trend in Goodwill/Net Assets (Book Value of Total Equity) 4B. Trend in Intangibles (including Goodwill)/Net Assets 5A. Trend in Goodwill/Market Capitalisation 5B. Trend in Intangibles (including Goodwill)/Market Capitalisation 6. Number of Companies that Recognised Goodwill or Intangibles Exceeding 50% of Net Assets in 2014 7. Trend in Breakdown of Market Capitalisation 1 Copyright © 2016 European Financial Reporting Advisory Group and Accounting Standards Board of Japan. All rights reserved. 財務会計基準機構のWebサイトに掲載した情報は、著作権法及び国際著作権条約をはじめ、その他の無体財産権に関する法律並びに条約によって保護 されています。許可なく複写・転載等を行うことはこれらの法律により禁じられています。 審議事項(2)-2 GW 2016-2 INDEX 8. Analysis of Average Goodwill per Company by Industry in 2014 9. Analysis of Goodwill/Net Assets by Industry in 2014 10. Trend in Number of Companies with Goodwill Impairment (and Amortisation, if applicable) 11. Trend in Amounts of Goodwill Impairment and Acquisition & Other Changes 12. Implicit Life of Goodwill 13. Trend in Goodwill Impairment Compared to the Stock Market Index 14. Next Steps 2 Copyright © 2016 European Financial Reporting Advisory Group and Accounting Standards Board of Japan. All rights reserved. 財務会計基準機構のWebサイトに掲載した情報は、著作権法及び国際著作権条約をはじめ、その他の無体財産権に関する法律並びに条約によって保護 されています。許可なく複写・転載等を行うことはこれらの法律により禁じられています。 審議事項(2)-2 1. NUMBER OF COMPANIES ANALYSED & NUMBER OF COMPANIES THAT ACCOUNTED FOR 50% OF TOTAL GOODWILL IN 2014 GW 2016-2 We analysed data of 4 indices comprising more than 1,000 companies (covering the U.S., Europe and Asia-Oceania) from 2007 to 2014. Concentration of goodwill at the top end was a common feature of all indices. For all indices, less than 11% of the population accounted for 50% of total goodwill. # of Companies Analysed Index # of companies analysed S&P 443 Europe 328 Nikkei 164 ASX 134 Total 1,069 Note 1 Names (and abbreviations) of indices that represented the regions covered in this presentation are as follows: • S&P 500 index (‘S&P’) of the U.S. • S&P Europe 350 index (‘Europe’) of Europe • Nikkei 225 index (‘Nikkei’) of Japan (only those companies that applied Japanese GAAP throughout 2005-2014) • S&P ASX 200 index (‘ASX’) of Australia # of Companies that Accounted for 50% of Total Goodwill (in 2014) # of companies that % of companies within the Index accounted for 50% population of total goodwill S&P 35 7.9% Europe 35 10.7% Nikkei 8 4.9% ASX 9 6.7% Note 2 Data for Nasdaq 100 index of the U.S., Hang Seng 50 index of Hong Kong and KOSPI 100 index of Korea were also collected and analysed. They were not included in this presentation because they provided similar results to one or more of the indices listed above. 3 Data source: Bloomberg (for S&P, Nikkei and ASX) and S&P Capital IQ (for Europe) Copyright © 2016 European Financial Reporting Advisory Group and Accounting Standards Board of Japan. All rights reserved. 財務会計基準機構のWebサイトに掲載した情報は、著作権法及び国際著作権条約をはじめ、その他の無体財産権に関する法律並びに条約によって保護 されています。許可なく複写・転載等を行うことはこれらの法律により禁じられています。 審議事項(2)-2 2. EVOLUTION OF GOODWILL AND GOODWILL IMPAIRMENT FROM 2007 TO 2014 GW 2016-2 From 2007 to 2014, total goodwill increased across all indices. Impairment charges were high in 2008 for Europe and S&P, and again in 2011 and 2012 mainly for Europe and ASX. Evolution of goodwill impairments (and amortisation, if applicable) from 2007 to 2014 (in USD billion) Evolution of total goodwill from 2007 to 2014 (in USD billion) 1,915 2,000 1,631 1,582 1,457 2,102 1,678 250 1,592 1,491 1,000 99 30 81 67 1,608 1,568 1,505 1,623 104 99 103 98 97 64 25 60 53 62 40 10 200 24 20 36 20 18 20 150 94 100 80 1,803 1,500 1,430 2,030 2,149 300 16 6 0 20 15 16 9 15 -20 100 100 10 10 -40 8 500 27 32 36 34 39 44 47 46 50 -60 0 2007 2008 S&P 2009 2010 Europe Data source: Bloomberg (for S&P, Nikkei and ASX) and S&P Capital IQ (for Europe) 2011 2012 Nikkei 2013 2014 ASX -100 3 2 2008 1 2009 1 2010 2 -80 0 3 1 2007 3 2 S&P Europe 2011 2012 Nikkei 4 4 3 3 5 1 2013 ASX 0 2014 4 Copyright © 2016 European Financial Reporting Advisory Group and Accounting Standards Board of Japan. All rights reserved. 財務会計基準機構のWebサイトに掲載した情報は、著作権法及び国際著作権条約をはじめ、その他の無体財産権に関する法律並びに条約によって保護 されています。許可なく複写・転載等を行うことはこれらの法律により禁じられています。 審議事項(2)-2 3. TREND IN AVERAGE GOODWILL PER COMPANY & TOTAL AMOUNT OF GOODWILL IN 2014 GW 2016-2 S&P and Europe had larger amounts of goodwill, both in average per company and in total, whereas Nikkei and ASX had smaller amounts. From 2008 to 2014, average goodwill per company for S&P increased constantly. In Europe, the average goodwill per company increased until 2011, then decreased in 2012-2013 and increased again in 2014. For both S&P and Europe, goodwill reached its highest level in 2014. USD million Average Goodwill per Company (for companies that recognised goodwill) Average and Total Goodwill in 2014 6,000 Average goodwill per company (USD billion) 5,000 4,000 S&P Europe 3,000 Nikkei S&P Europe Nikkei ASX 5.6 5.3 0.4 1.0 number of Total companies goodwill that (USD recognised billion) goodwill 385 306 121 102 2,149 1,623 46 100 ASX 2,000 Note Most business combinations have been accounted for under the purchase method since 2006. Until then, the pooling-of-interests method was commonly used. 1,000 0 2007 2008 2009 Data source: Bloomberg (for S&P, Nikkei and ASX) and S&P Capital IQ (for Europe) 2010 2011 2012 2013 2014 5 Copyright © 2016 European Financial Reporting Advisory Group and Accounting Standards Board of Japan. All rights reserved. 財務会計基準機構のWebサイトに掲載した情報は、著作権法及び国際著作権条約をはじめ、その他の無体財産権に関する法律並びに条約によって保護 されています。許可なく複写・転載等を行うことはこれらの法律により禁じられています。 審議事項(2)-2 4A. TREND IN GOODWILL/NET ASSETS (BOOK VALUE OF TOTAL EQUITY) S&P (34% [average during 2007-2014]) and Europe (31%) showed higher ratios of goodwill to net assets. ASX (21%) indicated middle level figures, different from the modest figures of average goodwill per company. Europe and ASX decreased gradually during the period (Europe since 2008) due to the relatively higher increase in net assets. Figures of Nikkei were modest (4%) and steady. GW 2016-2 Goodwill (FY2007=100) 200.0 180.0 160.0 140.0 120.0 100.0 80.0 60.0 40.0 Goodwill / Net Assets 40.0% 35.0% Net Assets (FY2007=100) 30.0% 200.0 S&P 25.0% Europe 20.0% Nikkei ASX 15.0% 180.0 160.0 140.0 120.0 100.0 80.0 10.0% 60.0 40.0 5.0% 0.0% 2007 2008 2009 Data source: Bloomberg (for S&P, Nikkei and ASX) and S&P Capital IQ (for Europe) 2010 2011 2012 2013 2014 6 Copyright © 2016 European Financial Reporting Advisory Group and Accounting Standards Board of Japan. All rights reserved. 財務会計基準機構のWebサイトに掲載した情報は、著作権法及び国際著作権条約をはじめ、その他の無体財産権に関する法律並びに条約によって保護 されています。許可なく複写・転載等を行うことはこれらの法律により禁じられています。 審議事項(2)-2 4B. TREND IN INTANGIBLES (INCLUDING GOODWILL)/NET ASSETS Trend in intangibles/net assets was similar to the trend in goodwill/net assets. Europe (51% [average during 2007-2014]) showed slightly higher figures than S&P (49%) for intangibles. Both intangibles and net assets increased for Nikkei, resulting in little movement. GW 2016-2 Intangibles (FY2007=100) 200.0 180.0 160.0 140.0 120.0 100.0 80.0 60.0 70.0% Intangibles (including Goodwill) / Net Assets 40.0 60.0% Net Assets (FY2007=100) 200.0 50.0% S&P 180.0 160.0 40.0% Europe 30.0% 140.0 Nikkei 120.0 ASX 100.0 80.0 20.0% 60.0 40.0 10.0% 0.0% 2007 2008 2009 Data source: Bloomberg (for S&P, Nikkei and ASX) and S&P Capital IQ (for Europe) 2010 2011 2012 2013 2014 7 Copyright © 2016 European Financial Reporting Advisory Group and Accounting Standards Board of Japan. All rights reserved. 財務会計基準機構のWebサイトに掲載した情報は、著作権法及び国際著作権条約をはじめ、その他の無体財産権に関する法律並びに条約によって保護 されています。許可なく複写・転載等を行うことはこれらの法律により禁じられています。 5A. TREND IN GOODWILL/MARKET CAPITALISATION Goodwill to market capitalisation showed more volatility mainly due to volatility in market capitalisation. S&P and Europe showed higher figures but less outstanding compared to goodwill to net assets. 審議事項(2)-2 GW 2016-2 Goodwill (FY2007=100) 200.0 180.0 160.0 140.0 120.0 100.0 80.0 60.0 40.0 Goodwill / Market Cap. 30.0% Market Cap. (FY2007=100) 25.0% 200.0 20.0% S&P Europe 15.0% Nikkei ASX 10.0% 180.0 160.0 140.0 120.0 100.0 80.0 60.0 5.0% 40.0 0.0% 2007 2008 2009 Data source: Bloomberg (for S&P, Nikkei and ASX) and S&P Capital IQ (for Europe) 2010 2011 2012 2013 2014 8 Copyright © 2016 European Financial Reporting Advisory Group and Accounting Standards Board of Japan. All rights reserved. 財務会計基準機構のWebサイトに掲載した情報は、著作権法及び国際著作権条約をはじめ、その他の無体財産権に関する法律並びに条約によって保護 されています。許可なく複写・転載等を行うことはこれらの法律により禁じられています。 5B. TREND IN INTANGIBLES (INCLUDING GOODWILL)/MARKET CAPITALISATION Trend in intangibles/market capitalisation was similar to goodwill/market capitalisation. 審議事項(2)-2 GW 2016-2 Intangibles (FY2007=100) 200.0 180.0 160.0 140.0 120.0 100.0 80.0 60.0 Intangibles (including Goodwill) / Market Cap. 40.0 50.0% 45.0% 40.0% Market Cap. (FY2007=100) 200.0 35.0% S&P 30.0% Europe 25.0% Nikkei 180.0 160.0 140.0 120.0 20.0% ASX 15.0% 100.0 80.0 10.0% 60.0 5.0% 40.0 0.0% 2007 2008 2009 Data source: Bloomberg (for S&P, Nikkei and ASX) and S&P Capital IQ (for Europe) 2010 2011 2012 2013 2014 9 Copyright © 2016 European Financial Reporting Advisory Group and Accounting Standards Board of Japan. All rights reserved. 財務会計基準機構のWebサイトに掲載した情報は、著作権法及び国際著作権条約をはじめ、その他の無体財産権に関する法律並びに条約によって保護 されています。許可なく複写・転載等を行うことはこれらの法律により禁じられています。 6. NUMBER OF COMPANIES THAT RECOGNISED GOODWILL OR INTANGIBLES EXCEEDING 50% OF NET ASSETS IN 2014 審議事項(2)-2 GW 2016-2 Quite a number of companies in S&P and Europe recognised goodwill or intangibles exceeding 100% of their net assets. Some companies recognised goodwill or intangibles exceeding 100% of their market capitalisation. Goodwill Index vs. Net Assets # of companies 50% + analysed S&P Europe Nikkei ASX 443 328 164 134 100% + 155 107 0 27 Intangibles including Goodwill Index S&P Europe Nikkei ASX Data source: Bloomberg (for S&P, Nikkei and ASX) and S&P Capital IQ (for Europe) vs. Net Assets # of companies 50% + analysed 443 328 164 134 199 155 6 52 100% + (in 2014) vs. Market capitalisation 50% + 100% + 64 13 1 36 25 3 0 0 0 9 10 1 (in 2014) vs. Market capitalisation 50% + 100% + 114 42 3 82 66 14 0 2 0 29 27 5 10 Copyright © 2016 European Financial Reporting Advisory Group and Accounting Standards Board of Japan. All rights reserved. 財務会計基準機構のWebサイトに掲載した情報は、著作権法及び国際著作権条約をはじめ、その他の無体財産権に関する法律並びに条約によって保護 されています。許可なく複写・転載等を行うことはこれらの法律により禁じられています。 審議事項(2)-2 7. TREND IN BREAKDOWN OF MARKET CAPITALISATION GW 2016-2 For S&P and Europe, a large portion of market capitalisation (ie market value of equity) was not recognised in the statement of financial position. Market fluctuations affected the unrecognised value rather than goodwill. Market Index (Point) Unrecognised Value, GW, Net Assets less GW (USD billion) 20,000 S&P 15,000 1,500 1,000 10,674 9,174 9,758 10,000 6,627 7,974 1,000 10,000 9,187 8,781 5,687 5,334 4,451 5,000 1,631 1,582 1,678 2,149 2,030 2,102 1,803 1,915 500 5,000 5,144 6,806 6,702 2,275 2,351 1,399 2,298 1,096 1,430 1,457 1,491 4,500 4,498 3,756 3,892 4,175 2,876 2,798 3,338 0 3,703 3,691 500 1,505 1,623 1,592 1,608 1,568 3,694 3,914 3,979 4,264 2,900 2,590 3,040 3,567 0 2007 2008 2009 2010 2011 2012 2013 2014 9,578 7,780 7,510 4,743 3,594 1,500 Unrecognised Value Goodwill Net Assets less Goodwill Market Index 15,777 11,246 11,141 7,803 Market Index (Point) Europe 17,321 12,832 12,310 (USD billion) 20,000 2,000 Unrecognised Value Goodwill Net Assets less Goodwill Market Index 15,000 Unrecognised Value, GW, Net Assets less GW 0 0 2007 2008 2009 2010 2011 2012 2013 2014 11 Note: Figures in gray boxes represent Market Cap. (ie the sum of Unrecognised Value (yellow), Goodwill (green) and Net Assets less Goodwill (blue)) Data source: Bloomberg (for S&P, Nikkei and ASX) and S&P Capital IQ (for Europe) Copyright © 2016 European Financial Reporting Advisory Group and Accounting Standards Board of Japan. All rights reserved. 財務会計基準機構のWebサイトに掲載した情報は、著作権法及び国際著作権条約をはじめ、その他の無体財産権に関する法律並びに条約によって保護 されています。許可なく複写・転載等を行うことはこれらの法律により禁じられています。 審議事項(2)-2 7. TREND IN BREAKDOWN OF MARKET CAPITALISATION (CONT’D) GW 2016-2 Compared to S&P, Europe and ASX, Nikkei has much less unrecognised value. Market fluctuations affected recognised assets rather than goodwill. Unrecognised Value, GW, Net Assets less GW (USD billion) Unrecognised Value, GW, Net Assets less GW Market Index (JPY) Nikkei 2,000 1,161 1,000 245 27 724 32 500 889 768 938 42 813 34 36 861 861 815 1,009 44 39 878 977 1,516 68 1,500 10,000 47 (102) 952 983 1,089 492 680 5,000 498 94 99 255 288 575 544 441 99 104 103 361 381 403 97 100 3,000 98 439 473 495 2,000 0 (12) (500) 1,000 (5,000) 2007 2008 2009 2010 2011 2012 2013 2014 4,000 334 337 500 5,000 977 841 723 0 (82) 1,029 1,000 1,251 6,000 1,144 1,139 46 0 (77) 7,000 Unrecognised Value Goodwill Net Assets less Goodwill Market Index 15,000 1,204 219 Market Index (Point) ASX 2,000 Unrecognised Value Goodwill Net Assets less Goodwill Market Index 1,500 (USD billion) (500) 0 2007 2008 2009 2010 2011 2012 2013 2014 12 Note: Figures in gray boxes represent Market Cap. (ie the sum of Unrecognised Value (yellow), Goodwill (green) and Net Assets less Goodwill (blue)) Data source: Bloomberg (for S&P, Nikkei and ASX) and S&P Capital IQ (for Europe) Copyright © 2016 European Financial Reporting Advisory Group and Accounting Standards Board of Japan. All rights reserved. 財務会計基準機構のWebサイトに掲載した情報は、著作権法及び国際著作権条約をはじめ、その他の無体財産権に関する法律並びに条約によって保護 されています。許可なく複写・転載等を行うことはこれらの法律により禁じられています。 審議事項(2)-2 8. ANALYSIS OF AVERAGE GOODWILL PER COMPANY BY INDUSTRY IN 2014 GW 2016-2 The telecommunications services industry in S&P and Europe had significantly larger amounts of goodwill per company. Consumer staples and health care in S&P and Europe showed larger amounts. Unlike other indices, the utilities industry in Europe recognised a larger amount of goodwill per company. (USD million) 30,000 Average Goodwill per Company (that recognised Goodwill) by Industry 25,000 20,000 15,000 10,000 5,000 0 Market Average Energy Materials Industrials Consumer Discretionary Consumer Staples Health Care Financials Information Technology Telecommunication Services Utilities S&P 5,582 3,050 3,011 5,662 3,250 7,170 7,649 6,707 5,608 25,996 2,298 Europe 5,303 2,168 3,217 3,647 3,814 10,326 10,939 4,019 4,518 13,992 6,982 Nikkei 383 12 249 206 54 1,002 983 891 260 153 91 ASX 983 1,866 987 340 361 2,054 913 1,745 664 639 536 Data source: Bloomberg (for S&P, Nikkei and ASX) and S&P Capital IQ (for Europe) 13 Copyright © 2016 European Financial Reporting Advisory Group and Accounting Standards Board of Japan. All rights reserved. 財務会計基準機構のWebサイトに掲載した情報は、著作権法及び国際著作権条約をはじめ、その他の無体財産権に関する法律並びに条約によって保護 されています。許可なく複写・転載等を行うことはこれらの法律により禁じられています。 審議事項(2)-2 GW 2016-2 9. ANALYSIS OF GOODWILL/NET ASSETS BY INDUSTRY IN 2014 Similar to average goodwill per company, the telecommunication services, consumer staples and health care industries indicated higher figures. Industrials in S&P and Europe also showed higher figures. ASX ranked higher in some industries, particularly the information technology industry. Consumer staples and health care industries in Nikkei showed relatively higher figures compared to other industries. 140.0% Goodwill / Net Assets by Industry 120.0% 100.0% 80.0% 60.0% 40.0% 20.0% 0.0% Market Average Energy Materials Industrials Consumer Discretionary Consumer Staples Health Care Financials TelecomInformation munication Technology Services Utilities S&P 32.3% 7.1% 41.5% 57.2% 44.9% 55.2% 59.3% 18.2% 36.8% 100.8% 15.9% Europe 27.6% 5.4% 18.5% 58.6% 29.5% 65.1% 62.8% 11.5% 56.5% 59.9% 31.9% Nikkei 3.6% 0.5% 4.1% 2.7% 0.6% 17.1% 23.9% 2.0% 6.0% 0.6% 0.3% ASX 16.8% 12.9% 6.9% 26.9% 42.8% 47.8% 72.9% 14.2% 117.0% 13.9% 20.4% Data source: Bloomberg (for S&P, Nikkei and ASX) and S&P Capital IQ (for Europe) 14 Copyright © 2016 European Financial Reporting Advisory Group and Accounting Standards Board of Japan. All rights reserved. 財務会計基準機構のWebサイトに掲載した情報は、著作権法及び国際著作権条約をはじめ、その他の無体財産権に関する法律並びに条約によって保護 されています。許可なく複写・転載等を行うことはこれらの法律により禁じられています。 審議事項(2)-2 10. TREND IN NUMBER OF COMPANIES WITH GOODWILL IMPAIRMENT (AND AMORTISATION, IF APPLICABLE) GW 2016-2 A relatively small number of companies experienced goodwill impairment. Percentage of companies that experienced goodwill impairment were higher for Europe than for S&P and ASX. # of Companies with Goodwill Impairment (and Amortisation, if applicable) Index S&P Europe Nikkei ASX # of companies analysed 443 328 164 134 2007 2008 2009 2010 15 68 67 12 47 98 69 22 41 84 68 16 30 70 62 21 2011 2012 2013 2014 28 77 67 22 45 87 75 17 29 89 74 18 27 84 80 18 Note Companies with Goodwill Impairment (& Amortisation, if applicable) / Companies with Goodwill Index S&P Europe Nikkei ASX # of companies analysed 443 328 164 134 Data source: Bloomberg (for S&P, Nikkei and ASX) and S&P Capital IQ (for Europe) 2007 2008 2009 2010 2011 2012 2013 2014 3.9% 23.5% 72.8% 12.0% 7.3% 25.8% 55.4% 21.0% 11.7% 29.5% 62.0% 16.2% 12.1% 33.7% 73.4% 21.6% 10.8% 29.0% 73.1% 15.4% 7.9% 23.6% 60.2% 19.6% 7.5% 29.7% 60.2% 17.3% 7.0% 27.5% 66.1% 17.6% Japanese accounting standards have consistently required amortisation of goodwill. Hence, ‘Companies with Goodwill Impairment (and Amortisation, if applicable) / Companies with Goodwill’ theoretically should be 100%. However, due to limitation of the data gathered, the figures were less than 100%. 15 Copyright © 2016 European Financial Reporting Advisory Group and Accounting Standards Board of Japan. All rights reserved. 財務会計基準機構のWebサイトに掲載した情報は、著作権法及び国際著作権条約をはじめ、その他の無体財産権に関する法律並びに条約によって保護 されています。許可なく複写・転載等を行うことはこれらの法律により禁じられています。 審議事項(2)-2 11. TREND IN AMOUNTS OF GOODWILL IMPAIRMENT AND ACQUISITION & OTHER CHANGES GW 2016-2 S&P recorded smaller amounts of goodwill impairment compared to acquisitions & other changes, resulting in continuous increases in the goodwill amount. In 2012-2013, the decline of goodwill in Europe was due to less net acquisitions and high impairment charges. The recovery in 2014 was due to significant new additions of goodwill and lower impairments. Acquisition & Other Changes, Impairment USD million 200,000 Acquisition & Other Changes, Impairment S&P Europe USD million 200,000 150,000 150,000 100,000 100,000 50,000 50,000 0 0 (50,000) (50,000) (100,000) (100,000) 2008 2009 2010 2011 Acquisition & Other Changes Data source: Bloomberg (for S&P, Nikkei and ASX) and S&P Capital IQ (for Europe) 2012 2013 2014 Impairment 2008 2009 2010 2011 Acquisition & Other Changes 2012 2013 2014 Impairment 16 Copyright © 2016 European Financial Reporting Advisory Group and Accounting Standards Board of Japan. All rights reserved. 財務会計基準機構のWebサイトに掲載した情報は、著作権法及び国際著作権条約をはじめ、その他の無体財産権に関する法律並びに条約によって保護 されています。許可なく複写・転載等を行うことはこれらの法律により禁じられています。 審議事項(2)-2 11. TREND IN AMOUNTS OF GOODWILL IMPAIRMENT AND ACQUISITION & OTHER CHANGES (CONT’D) GW 2016-2 Nikkei record a relatively stable amount of impairment & amortisation compared to the amount of goodwill, resulting in modest changes in the goodwill amount. ASX recorded a relatively large amount of impairment in 2011 and 2012, resulting in decreases in the goodwill amount. Acquisition & Other Changes, Impairment & Amortisation Acquisition & Other Changes, Impairment Nikkei USD million ASX USD million 8,000 8,000 4,000 4,000 0 0 (4,000) (4,000) (8,000) (8,000) (12,000) 2008 (12,000) 2008 2009 2010 2011 Acquisition & Other Changes 2012 2013 2009 2010 2011 2012 2013 2014 2014 Impairment & Amortisation Acquisition & Other Changes Impairment 17 Data source: Bloomberg (for S&P, Nikkei and ASX) and S&P Capital IQ (for Europe) Copyright © 2016 European Financial Reporting Advisory Group and Accounting Standards Board of Japan. All rights reserved. 財務会計基準機構のWebサイトに掲載した情報は、著作権法及び国際著作権条約をはじめ、その他の無体財産権に関する法律並びに条約によって保護 されています。許可なく複写・転載等を行うことはこれらの法律により禁じられています。 審議事項(2)-2 12. IMPLICIT LIFE OF GOODWILL GW 2016-2 For S&P and Europe, the ratio of goodwill impairment to the goodwill amount of the previous year-end ranged from 1%-5%. The ratio was higher for Nikkei (around 7%10%) . The implicit life of goodwill (ie the inverse of the above ratio) in 2014 was 11 years for Nikkei and more than 70 years for other indices. 12.0% Goodwill of the previous year/ Goodwill Impairment (& Amortisation) in 2014 Goodwill Impairment (& Amortisation) / Goodwill of the previous year end (years) 130.5 10.0% 8.0% 82.8 6.0% 11.4 4.0% 75.2 2.0% 0.0% 2008 2009 S&P 2010 Europe Data source: Bloomberg (for S&P, Nikkei and ASX) and S&P Capital IQ (for Europe) 2011 2012 Nikkei 2013 ASX 2014 0.0 20.0 40.0 S&P 60.0 Europe 80.0 Nikkei 100.0 ASX 120.0 140.0 18 Copyright © 2016 European Financial Reporting Advisory Group and Accounting Standards Board of Japan. All rights reserved. 財務会計基準機構のWebサイトに掲載した情報は、著作権法及び国際著作権条約をはじめ、その他の無体財産権に関する法律並びに条約によって保護 されています。許可なく複写・転載等を行うことはこれらの法律により禁じられています。 審議事項(2)-2 13. TREND IN GOODWILL IMPAIRMENT COMPARED TO THE STOCK MARKET INDEX GW 2016-2 Goodwill impairment generally increased when the stock market index showed a downward trend. For S&P, Europe and ASX, the stock market index did not seem to explain the 2012 increase of goodwill impairment (ie the stock market index showed an upward trend). USD million 70,000 S&P Market Index (Point) 2,500 60,000 2,000 50,000 USD million 100,000 Europe Market Index (Point) 1,600 80,000 1,400 60,000 40,000 1,200 1,500 30,000 40,000 20,000 1,000 1,000 20,000 10,000 0 500 0 2007 2008 2009 2010 2011 2012 2013 2014 Goodwill Impairment Market Index USD million 5,000 Nikkei 20,000 USD million 12,000 18,000 10,000 16,000 8,000 14,000 6,000 12,000 4,000 10,000 2,000 Market Index (JPY) 4,000 800 2007 2008 2009 2010 2011 2012 2013 2014 Goodwill Impairment Market Index ASX Market Index (Point) 7,000 6,000 3,000 2,000 1,000 0 8,000 2007 2008 2009 2010 2011 2012 2013 2014 Goodwill Impairment & Amortisation Data source: Bloomberg (for S&P, Nikkei and ASX) and S&P Capital IQ (for Europe) Market Index 5,000 4,000 0 3,000 2007 2008 2009 2010 2011 2012 2013 2014 Goodwill Impairment Market Index 19 Copyright © 2016 European Financial Reporting Advisory Group and Accounting Standards Board of Japan. All rights reserved. 財務会計基準機構のWebサイトに掲載した情報は、著作権法及び国際著作権条約をはじめ、その他の無体財産権に関する法律並びに条約によって保護 されています。許可なく複写・転載等を行うことはこれらの法律により禁じられています。 14. NEXT STEPS 審議事項(2)-2 GW 2016-2 Data show significant variation across industries both in terms of absolute and relative weight of goodwill and intensity of impairment. Is it possible to explain these differences by the characteristics and economic trends in the industries? Case study of some large M&A transactions might be useful to gain further insight on the accounting for business combinations. Information to be collected and analysed may include the amounts and types of consideration paid, amounts (and types) of goodwill and intangibles recognised, and whether any impairment losses have been recognised with regard to these goodwill or intangibles. 20 Copyright © 2016 European Financial Reporting Advisory Group and Accounting Standards Board of Japan. All rights reserved. 財務会計基準機構のWebサイトに掲載した情報は、著作権法及び国際著作権条約をはじめ、その他の無体財産権に関する法律並びに条約によって保護 されています。許可なく複写・転載等を行うことはこれらの法律により禁じられています。 審議事項(2)-2 GW 2016-2 Thank you for your attention! ANY QUESTIONS? EFRAG receives financial support of the European Union-DG Fisma. The contents of this presentation is the sole responsibility of EFRAG and can under no circumstances be regarded as reflecting the position of the European Union. 財務会計基準機構のWebサイトに掲載した情報は、著作権法及び国際著作権条約をはじめ、その他の無体財産権に関する法律並びに条約によって保護されています。許可なく複写・転載等を行うこ とはこれらの法律により禁じられています。 21
© Copyright 2026 ExpyDoc