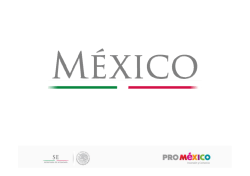
FACTSHEET - 01.03.2016
Solactive Global Oil Equities Net Total Return Index
DESCRIPTION
The Solactive Global Oil Equities Index tracks the price movements in shares of companies in the global oil industry
whose share prices have the highest historical correlation to the spot price of oil among their peers. A maximum of
25 components are included and weighted equally. The index is adjusted semi-annually and calculated as a total
return index calculated in USD.
HISTORICAL PERFORMANCE*
130
120
110
100
90
80
70
60
50
40
30
Jan-2007
Jan-2008
Jan-2009
Jan-2010
Jan-2011
Jan-2012
Jan-2013
Jan-2014
Jan-2015
Jan-2016
CHARACTERISTICS
ISIN/WKN
Bloomberg / Reuters
Index Calculator
Index Type
Index Currency
Index Members
Dividends
DE000SLA20N5 / SLA20N
Base Value / Base Date
100 Points / 16.02.2012
SOLGLOIN Index / .SOLGLOIN
Last Price
36.0244
Solactive AG
52W High
76.78
Industry / Sector
52W Low
USD
25
Reinvested (Net Total Return Index)
Calculation
History
30.14
09:00am to 10:30pm (CET), every 15 seconds
Available daily back to 16.02.2012
FACTSHEET - 01.03.2016
Solactive Global Oil Equities Net Total Return Index
STATISTICS
30D
90D
180D
360D
YTD
Since
Inception
-6.1%
-27.4%
-25.5%
-44.7%
-13.2%
-64.0%
-53.4%
-72.7%
-45.0%
-45.2%
-57.1%
-22.3%
56.4%
63.4%
54.3%
46.2%
66.2%
32.6%
High
37.27
49.62
56.58
76.78
41.49
121.76
Low
32.30
30.14
30.14
30.14
30.14
30.14
Sharpe Ratio
-0.95
-1.16
-0.84
-1.00
-0.88
-0.72
-15.8%
-42.5%
-46.7%
-60.7%
-27.4%
-75.2%
USD
Performance
Performance (p.a.)
Volatility (p.a.)
Max. Drawdown
VaR 95 \ 99
-74.6%\-120.1%
-53.4%\-90.8%
CVaR 95 \ 99
-96.6%\-134.4%
-79.6%\-123.5%
CURRENCY EXPOSURE
COUNTRY EXPOSURE
US 78.2%
USD 82.4%
CA 17.6%
CAD 17.6%
BM 4.2%
TOP COMPONENTS
Ticker
Currency
Country
Company
Weight
RSPP UN Equity
USD
US
RSP PERMIAN INC
4.73%
WCP CT Equity
CAD
CA
WHITECAP RESOURCES INC
4.58%
CPG CT Equity
CAD
CA
CRESCENT POINT ENERGY CORP
4.44%
PTEN UW Equity
USD
US
PATTERSON-UTI ENERGY INC
4.41%
EGN UN Equity
USD
US
ENERGEN CORP
4.38%
CLR UN Equity
USD
US
CONTINENTAL RESOURCES INC/OK
4.36%
VET CT Equity
CAD
CA
VERMILION ENERGY INC
4.30%
HP UN Equity
USD
US
HELMERICH & PAYNE
4.24%
PXT CT Equity
CAD
CA
PAREX RESOURCES INC
4.23%
NBR UN Equity
USD
BM
NABORS INDUSTRIES LTD
4.22%
MTDR UN Equity
USD
US
MATADOR RESOURCES CO
4.14%
PXD UN Equity
USD
US
PIONEER NATURAL RESOURCES CO
4.07%
HES UN Equity
USD
US
HESS CORP
4.05%
MRO UN Equity
USD
US
MARATHON OIL CORP
3.90%
APC UN Equity
USD
US
ANADARKO PETROLEUM CORP
3.89%
FANG UW Equity
USD
US
DIAMONDBACK ENERGY INC
3.85%
COP UN Equity
USD
US
CONOCOPHILLIPS
3.84%
FACTSHEET - 01.03.2016
Solactive Global Oil Equities Net Total Return Index
Ticker
Currency
Country
Company
Weight
CXO UN Equity
USD
US
CONCHO RESOURCES INC
3.84%
NBL UN Equity
USD
US
NOBLE ENERGY INC
3.73%
XEC UN Equity
USD
US
CIMAREX ENERGY CO
3.72%
WLL UN Equity
USD
US
WHITING PETROLEUM CORP
3.55%
EOG UN Equity
USD
US
EOG RESOURCES INC
3.52%
CRZO UW Equity
USD
US
CARRIZO OIL AND GAS INC
3.40%
QEP UN Equity
USD
US
QEP RESOURCES INC
3.33%
DVN UN Equity
USD
US
DEVON ENERGY CORPORATION
3.25%
FACTSHEET - 01.03.2016
Solactive Global Oil Equities Net Total Return Index
For more information, please visit www.solactive.com.
* Past performance is no guarantee of future results and may be lower or higher than current performance. Index returns are no guarantee for any returns of financial products linked to the
index. Any performance information regarding financial products linked to the index can reflect temporary waivers of expenses and/or fees and does not include insurance/annuity fees and
expenses.
This info service is offered exclusivley by Solactive AG, Guiollettstr. 54, D-60325 Frankfurt am Main, E-Mail [email protected] | Disclaimer: The financial instrument is not sponsored,
promoted, sold or supported in any other manner by Solactive AG nor does Solactive AG offer any express or implicit guarantee or assurance either with regard to the results of using the Index
and/or Index trade mark or the Index Price at any time or in any other respect. The Index is calculated and published by Solactive AG. Solactive AG uses its best efforts to ensure that the Index
is calculated correctly. Irrespective of its obligations towards the Issuer, Solactive AG has no obligation to point out errors in the Index to third parties including but not limited to investors and/or
financial intermediaries of the financial instrument. Neither publication of the Index by Solactive AG nor the licensing of the Index or Index trade mark for the purpose of use in connection with
the financial instrument constitutes a recommendation by Solactive AG to invest capital in said financial instrument nor does it in any way represent an assurance or opinion of Solactive AG with
regard to any investment in this financial instrument. This document is for the information and use of professional advisers only. Remember, the information in this document does not constitute
tax, legal or investment advice and is not intended as a recommendation for buying or selling securities. The information and opinions contained in this document have been obtained from
public sources believed to be reliable, but no representation or warranty, express or implied, is made that such information is accurate or complete and it should not be relied upon as such.
Solactive AG and all other companies mentioned in this document will not be responsible for the consequences of reliance upon any opinion or statement contained herein or for any omission. |
Solactive AG, 2013. All rights reserved.
© Copyright 2026 ExpyDoc