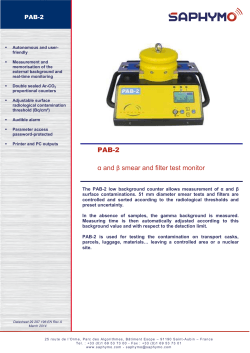
Italian Research Company Update KINEXIA Milan, July 15, 2014 OUTPERFORM Price (Eu): 2.26 Target Price (Eu): 2.70 SECTOR: Utilities Fabrizio Barini +39-02-77115.319 e-mail: [email protected] +39-02-77115.252 Rita Mombello e-mail: [email protected] A Rising Star in the Renewable Energy Galaxy Continual modernisation. Kinexia is a leading player in the Italian renewable energy sector, one of the businesses with the highest potential in the country. The company is active in three main areas: renewable energy, heating and, more recently, environment management (especially waste management). This last business has become a major focus for Kinexia since it signed a deal to buy 32.7% of Waste Italia last month. Kinexia will now own 86.83% of Waste Italia, a company with a solid base of over 3,000 clients, 9 waste selection centers, 7 waste collection points, 5 landfill areas and an extensive commercial network present across all of Italy. We estimate that this deal will be value-accretive starting from 2015. 2014-2018 Business Plan. The company has highlighted key development areas and goals to be achieved by 2018 in its recently presented 5-year business plan. The company’s goal is still to foster the development of technological solutions for energy production from renewable sources and to provide environmental services. The strategy for the years to come is to increase both revenues and profit margins from stable assets (biogas from landfills and district heating) as well as to develop integration activities and synergies in the waste management sector through cross-selling and commercial network integration. In addition, Kinexia is seeking to increase retail market penetration with new partnerships and to expand abroad into the Far East, Northern Africa, the Middle East and Eastern Europe. Several projects are already in the pipeline, such as an integrated project under development in Far East, an efficiency pilot project in the Middle East and a waste disposal project in North Africa. OUTPERFORM, target price Eu2.70. We have a positive view on the merger operation as the group will diversify operative risk in a difficult time for the renewable energy sector. Business plan goals look feasible in the long run, but in the short/medium term visibility is still low. Our valuation is based on an SOP method for the different business units: Waste, District Heating, Renewable Power Generation, EPC & O&M, Energy Efficiency and Services. For each business line, we have used different valuation methods, including peer group multiples for industrial operations and DCFs for utility operations. The resulting fair value is Eu3.2, to which we have applied a justified reasonable 20% discount for low visibility and liquidity versus its sector peers, leading to a target price of Eu2.70. Key Figures 2012A 2013A 2014E 2015E 2016E Sales (Eu mn) Ebitda (Eu mn) Net profit (Eu mn) EPS - New (Eu) EPS - Old (Eu) DPS (Eu) 62 9 1 -0,009 -0,009 0,000 164 54 4 0,052 0,052 0,020 172 46 5 0,092 0,193 0,029 192 60 7 0,125 0,294 0,039 211 68 15 0,258 Ratios & Multiples 2012A 2013A 2014E 2015E 2016E nm 0,0% 22,6 7,6% 43,0 0,9% 5,7 21,4% 24,6 1,3% 5,6 17,8% 18,0 1,7% 4,3 20,3% 8,8 3,6% 3,6 33,0% P/E Div. Yield EV/Ebitda ROCE 0,081 KINEXIA - 12m Performance 2,6 2,4 2,2 2,0 1,8 1,6 1,4 1,2 1,0 l-13 s-13 n-13 KINEXIA g-14 m-14 m-14 KINEXIA Rel. to BCI Index (Reb.) RATING: OUTPERFORM TARGET PRICE (Eu): from 1.80 to 2.70 Change in EPS est: 2014E 2015E nm nm STOCK DATA Reuters code: Bloomberg code: Performance Absolute Relative 12 months H/L: KINX.MI KNX IM 1m -3,0% 1,7% 3m 12m -4,3% 91,0% -0,8% 60,1% 2.53/1.16 SHAREHOLDER DATA No. of Ord. shares (mn): Total No. of shares (mn): Mkt Cap Ord (Eu mn): Total Mkt Cap (Eu mn): Mkt Float - ord (Eu mn): 59 59 133 133 25 Mkt Float (in %): 18,8% Main shareholder: Pietro Colucci 44,4% BALANCE SHEET DATA Book value (Eu mn): BVPS (Eu): P/BV: Net Financial Position (Eu mn): Enterprise value (Eu mn): Please see important disclaimer on the last page of this report The reproduction of the information, recommendations and research produced by Intermonte SIM contained herein, and of any of its parts, is strictly prohibited. None of the contents of this document may be shared with third parties without Company authorization. Intermonte SIM S.p.A. Milan 20122 (Italy) - Corso Vittorio Emanuele II, 9 - phone: +39-02-77115.1 fax: +39-02-77115.300 New York - (USA) - Sales contacts: JPP Eurosecurities, 595 Madison Avenue, 10022 - phone: +1 (212) 521 6718 2014 109 1,40 1,6 -129 261 [email protected] 2012A 2013A 2014E 2015E 2016E 31/12/2012 31/12/2013 31/12/2014 31/12/2015 31/12/2016 Sales EBITDA EBIT Financial income (charges) Associates & Others Pre-tax profit (Loss) Taxes Tax rate (%) Minorities & discontinue activities Net profit Total extraordinary items Ebitda excl. extraordinary items Ebit excl. extraordinary items Net profit restated 62 9 3 (1) 0 2 (1) -69,5% 0 1 0 9 4 (0) 164 54 16 (10) 0 7 (3) -40,3% (1) 4 1 54 16 3 172 46 18 (10) 1 9 (4) -45,2% 0 5 0 46 18 5 192 60 22 (10) 1 13 (6) -47,1% 0 7 0 60 22 7 211 68 33 (8) 1 25 (10) -41,4% 0 15 0 68 33 15 PER SHARE DATA (Eu) Total shares out (mn) - average fd EPS stated fd EPS restated fd BVPS fd Dividend per share (ord) Dividend per share (sav) Dividend pay out ratio (%) 29 0,025 -0,009 1,750 0,000 0,000 59 0,062 0,052 1,698 0,020 0,000 59 0,092 0,092 1,397 0,029 0,000 59 0,125 0,125 1,949 0,039 0,000 59 0,258 0,258 2,039 0,081 0,000 CASH FLOW (Eu mn) Gross cash flow Change in NWC Capital expenditure Other cash items Free cash flow (FCF) Acquisitions, divestments & others Dividend Equity financing/Buy-back Change in Net Financial Position 6 (6) (10) 0 0 (1) 0 0 (9) 43 (63) (25) 0 (46) (1) 0 0 (46) 33 (2) (19) 0 12 39 (1) 0 50 45 (2) (40) 0 2 (1) (2) 6 6 51 (9) (26) 0 15 (1) (2) 0 12 Total fixed assets Net working capital Long term liabilities Net capital employed Net financial position Group equity Minorities Net equity 162 (24) (77) 61 (65) 55 (5) 50 219 47 (179) 88 (179) 121 (43) 78 200 49 (129) 120 (129) 125 (16) 109 169 52 (123) 98 (123) 130 (16) 114 151 60 (111) 101 (111) 142 (16) 127 Average mkt cap - current Adjustments (associate & minorities) Net financial position Enterprise value 133 0 (65) 198 133 0 (179) 311 133 0 (129) 261 133 0 (123) 256 133 0 (111) 243 EBITDA margin* EBIT margin* Gearing - Debt/equity Interest cover on EBIT Debt/Ebitda ROCE* ROE* EV/CE EV/Sales EV/Ebit Free Cash Flow Yield 14,2% 6,5% 119,0% 2,3 7,44 7,6% 1,5% 4,5 1,3 nm 0,0% 33,2% 9,7% 147,3% 1,7 3,28 21,4% 5,7% 4,2 1,9 19,5 -34,5% 27,0% 10,7% 102,9% 1,8 2,77 17,8% 5,8% 2,5 1,5 14,1 9,0% 31,0% 11,5% 94,7% 2,3 2,06 20,3% 6,6% 2,3 1,3 11,6 1,5% 32,3% 15,5% 77,9% 4,0 1,62 33,0% 12,6% 2,5 1,2 7,4 11,7% Sales EBITDA* EBIT* Net profit EPS restated -30,2% -43,4% nm nm nm 163,9% 519,3% 295,2% 395,7% nm 5,0% -14,7% 16,0% 47,9% 75,1% 11,7% 28,3% 19,7% 36,4% 36,4% 9,7% 14,4% 47,8% 105,8% 105,8% Fiscal year end PROFIT & LOSS (Eu mn) BALANCE SHEET (Eu mn) ENTERPRISE VALUE (Eu mn) RATIOS(%) GROWTH RATES (%) * Excluding extraordinary items Source: Intermonte SIM estimates 2 [email protected] KINEXIA - KEY FIGURES 3 Corporate Structure and Business Description Kinexia’s Ownership Structure Management Waste Italia at a Glance Merger Valuation SOP Valuation Business Plan to 2018 Key Financials, Before & After Incorporation of Waste Italia Sector Trends APPENDIX [email protected] TABLE OF CONTENTS Corporate Structure & Business Description Kinexia SpA is a holding company whose operating subsidiaries are active in the renewable energy and environment management sectors. The main business units are: Photovoltaic: Kinexia has built a total of 46MW of solar parks, of which 1MW is still owned Wind: the company is currently building a 30MW wind farm in Calabria Biomass and Biogas plants: Kinexia owns 6 biogas by landfill plants with a generation capacity of 6.3MW and 7 biomass plants with a capacity of 7MW District Heating: a cogeneration power plant with installed capacity of 19.4MWe plus a support thermal plant, for combined thermal power of 100MWth Environment Management: disposal landfill with a residual capacity of 2.8mn tons; authorization for a 1MW waste digestion plant in Vigevano; acquisition of two new initiatives in the environmental area should enable important synergies Waste Collection: 7 depots and about 150 collection vehicles, 65 of which are owned Source: Company presentation 4 Selection & Treatment: 8 selection plants, an RDF production plant and a tyre treatment site Landfills: 5 landfill sites are in operation and 3 sites are in post-closure phase [email protected] through subsidiary Waste Italia, which is going to obtain additional authorizations 5 Kinexia’s Ownership Structure Kinexia (formerly Schiapparelli 1824) was initially established as a producer of cosmetics and nutrition products. In July 2008, the company diversified into renewable energy production, which soon became the core business. The company’s leading stakeholder is Mr. Pietro Colucci, who is also Chairman and CEO. Shareholders pre- and post-merger Pietro Colucci Francesco Colucci Davide Scarantino Palmiro Comune di Settimo Tse Synergo Floating TOT Kinexia Standalone Sostenya Kinexia +Sostenya Synergo w/o POC Kinexia +Synergo Synergo w POC Kinexia +Synergo % # # # % # # % # # % 40% 11.708.136 14.387.293 26.095.429 60% 0 26.095.429 47% 0 26.095.429 44% 6% 1.846.617 0 1.846.617 4% 0 1.846.617 3% 0 1.846.617 3% 3% 4% 981.345 1.133.471 0 0 981.345 1.133.471 2% 3% 0 0 981.345 1.133.471 2% 2% 0 0 981.345 1.133.471 2% 2% 16% 0% 31% 100% 4.628.853 0 9.012.955 29.311.377 0 0 0 14.387.293 4.628.853 0 9.012.955 43.698.670 4.628.853 12.404.580 9.012.955 56.103.250 8% 22% 16% 100% 0 2617201 0 2617201 4.628.853 15.021.781 9.012.955 58.720.451 8% 26% 15% 100% 11% 0 0% 12.404.580 21% 0 100% 12.404.580 Source: Company information Kinexia and Synergo have signed a strategic agreement where Kinexia will acquire 32.718% of the share capital of Waste Italia Holding SpA, the parent company of the Waste Italia group. After this acquisition, Kinexia’s total equity stake in Waste Italia, which will be incorporated into Kinexia, will go from 54.12% to 86.83%. Once Synergo is merged, Pietro Colucci will own 44% of the group (after initially moving up to 60% ownership following the merger with Waste Italia). Kinexia – Shareholders YTD Source: Company information [email protected] Shareholder s Kinexia post- merger Management Chairman and CEO: Pietro Colucci CFO: Marco Acquati Managing Director: Flavio Raimondo Head of Investor Relations: Raffaele Vanni Strategic Development: Valerio Verderio Business Development: Luca Borreale Commercial Director: Agostino Ferrari The new acquisition: Waste Italia at a Glance Waste Italia is the leading vertically integrated operator in the special waste management (WasteWay). It has over 3,000 customers and an average customer retention rate of 98%. Waste Italia collected 270,792 tons, processed 211,900 tons and disposed of 909,910 tons of special waste (LTM March 2014). Waste Italia can rely on a partner network so as to cover all of Italy through the WasteWay project: it has 50 partners in total, six “gold” partners with national coverage, characterized by sizeable operations and long-term relationships; 39,094 tons of waste was collected and disposed of through this partnership network in 2013. General business lines The company’s activities can be subdivided into three main areas: Source: Company internal data 6 Collection: collection of waste from producers via both a proprietary fleet and third parties Selection: sorting materials into recoverable and non-recoverable, compacting and refusederived fuel (RDF) Disposal: permanent waste disposal [email protected] sector with dominant market positions in Northern Italy and a national partnership network Source: Company internal data Source: Company internal data [email protected] 7 Source: Company internal data 8 [email protected] Source: Company internal data 9 Source: Company internal data Value chain of waste management Source: Company internal data [email protected] Evolution in Landfill Capacity Source: Company internal data Expected landfill capacity trend Source: Company internal data 10 [email protected] Customer retention history 11 Waste Italia Merger Valuation On 17th June 2014, Kinexia and Synergo signed a strategic agreement where Kinexia will acquire 32.7% of the share capital of Waste Italia Holding, the parent company of the Waste Italia Group. After this acquisition, Kinexia’s total equity stake in Waste Italia, which will be incorporated into Kinexia, will go from 54.1% to 86.8%. The equity value of the operation is Eu35mn, to be paid at closing (Eu28.9mn in Kinexia shares at Eu2.33 each, and Eu6.1mn through a Synergo bond with a strike price of Eu2.33 per share for a total of 2,617,201 shares. The closing is expected to take place by the end of September. After this deal is completed, Synergo will own 22.11% of Kinexia, while Kinexia’s majority stake in Waste Italia Holding will go up to 86.83%. The deadline for the completion of this merger is 31st December 2014. The reasons and benefits behind the merger can be summarized as follows: become the leading private sector player on the Italian market, capable of combining renewable energy and waste businesses grow through synergies to obtain competitive advantages strengthen the capital structure exploit cross-selling opportunities benefit from better regional coverage reach a critical mass to be able to compete to exploit new opportunities, including those in international markets risk diversification Kinexia + Waste Italia -Deal valuation (Pre-Synergies) Eu mn Kinexia Waste Italia Kinexia + Waste 2014E 2015E 2014E 2015E 2014E 2015E Ebitda 20,6 28,6 26,0 32,1 43,2 56,5 Net profit 2,4 3,4 1,5 2,5 3,7 5,6 NFP -92,4 -84,4 -83,3 -77,2 -164,7 -151,4 Debt/Ebitda -4,5 -2,9 -3,2 -2,4 -3,8 -2,7 N. shares 29,3 29,3 44,3 44,3 EPS 0,082 0,116 0,084 0,126 2,0% 8,3% 44,3 44,3 % change Tot. New shares issued 29,3 29,3 15,0 15,0 Equity Value 68,3 68,3 107,0 107,0 103,3 103,3 NFP -92,4 -84,4 -83,3 -77,2 -164,7 -151,4 EV 160,7 152,6 190,3 184,2 268,0 254,7 EV/Ebitda 7,8 5,3 7,3 5,7 6,2 4,5 P/E 28,4 20,1 71,3 42,8 27,9 18,5 Source: Intermonte analysis on company information The debt/EBITDA ratio of the combined company (Kinexia and Waste Italia) for 2014 is 3.8, versus 4.5 for Kinexia on a standalone basis. Likewise, with regard to EV/EBITDA, Kinexia postmerger will be at 6.2 in 2014 (while the company by itself would have a 7.8 multiple in 2014). In terms of EPS, the deal also has a positive effect. [email protected] SOP Valuation Putting the values of Waste Italia and Kinexia’s existing business together, we calculate a fair equity value (the average between 2014 and 2016 values) of Eu185.5mn or Eu3.2per share, of which Eu30.2mn is the value of the waste management business. We then applied a visibility and low liquidity discount of 20%, arriving at a target price of Eu2.70 per share. Sum of the Parts Eu mn 2014 2015 2016 Average Waste Italia (EV) 182,0 190,3 184,2 184,2 Old Kinexia 129,3 129,7 130,4 129,8 EPC&O&M 9,6 9,0 8,6 9,0 Power Generation 27,0 27,0 27,0 27,0 Comment Implied merger valuat ion Transact ion mult iples (Ternienergia/Sunpower Corp) Wast e (Faeco & Ot hers) 29,2 30,2 31,2 30,2 Book Value+Capex SEI (dist ric heat ing) 63,6 63,6 63,6 63,6 DCF (with WACC: 5.48%; NPV: Eu17.5mn; TV: 311,3 320,0 314,6 315,3 NFP - Year End -128,6 -123,1 -110,7 -125,8 Equity Fair Value cum minorites 182,7 196,9 203,8 189,5 Innovat ec 11,4 11,4 11,4 11,4 Minorities (13% Waste Italia , 27% SEI) -17,0 -17,0 -17,0 -17,0 Equity Fair Value ex minorites 177,1 191,3 198,2 188,9 Mn shares 58,7 58,7 58,7 58,7 Fair value ps 3,0 3,3 3,4 3,2 20,0% 20,0% 20,0% 20,0% 2,4 2,6 2,7 2,7 Visibility/Liquidity discount TARGET PRICE Current market cap Source: Intermonte estimates Peers Analysis Kinexia is overall cheaper than its market peers in the main segments of business as EV/EBITDA 2014 is 4.3 versus an average 2015 of 6.7 as well as Kinexia P/ E is 18.0 versus peers average running for 18.1 Price Company Mean Median Median Median Median Median Median Market Ev/EBITDA Ev/EBITDA Ev/EBITDA Ev/EBIT FY1 Ev/EBIT FY2 Ev/EBIT FY3 P/E FY1 Mean P/E FY2 P/E FY3 Net Div Net Div Net Div Cap. FY1 Yield FY1 Yield FY2 Yield FY3 FY2 Mean Mean Mean Mean FY3 POWER GENERATION Alerion Clean Power S.p.A. 3,30 145 9,6 8,8 27,6 20,0 48,8 30,4 3,6% 3,6% Falck Renewables S.p.A. 1,26 366 7,7 6,9 6,8 12,6 10,8 9,9 24,1 15,9 13,2 2,5% 2,5% 2,5% EDP Renov av eis SA 5,13 4.475 8,7 7,4 6,6 17,2 14,1 12,3 35,6 28,4 24,5 0,8% 1,0% 1,2% Abengoa S.A. Class A 4,50 3.258 7,9 7,8 7,1 13,3 12,7 11,1 29,9 17,9 13,8 2,5% 2,6% 2,6% ERG S.p.A. 11,80 1.774 5,8 5,4 5,0 12,2 11,2 10,4 20,3 18,1 17,7 4,2% 4,2% 4,2% ENVIRONEMENT Seche Env ironnement SA 25,40 219 6,3 5,8 5,5 14,9 13,2 13,0 23,1 15,9 14,5 3,6% 3,7% 3,8% Hera S.p.A. 2,05 2.911 6,5 6,3 6,2 12,5 11,8 11,5 18,7 17,0 16,1 4,3% 4,6% 4,8% A2A S.p.A. 0,80 2.479 5,9 5,7 5,2 12,4 11,7 10,4 13,2 12,5 10,6 4,5% 5,0% 5,0% ENEL Green Power 2,06 10.280 9,3 8,8 8,0 15,3 13,8 12,6 20,2 17,3 14,0 1,5% 1,7% 2,1% EPC TERNIENERGIA 2,02 63 5,5 4,6 4,0 8,9 7,4 6,1 9,3 7,4 6,4 3,6% 4,5% 5,2% KINEXIA 2,26 132,43 5,61 4,28 3,56 14,11 11,54 7,43 24,55 18,00 8,75 1,3% 1,7% 3,6% avg w/o Kinexia 5,83 2.597 7,3 6,7 6,0 14,7 12,7 10,8 24,3 18,1 14,5 3,1% 3,3% 3,5% avg w Kinexia 5,51 2.373 7,2 6,5 5,8 14,6 12,6 10,5 24,3 18,1 14,0 2,9% 3,2% 3,5% Source: Intermonte estimates for Falck, ERG, Hera, A2A, Enel GP, Ternienergia and Kinexia; Facset consensus for Alerion, EDP, Abengoa and Seché. 12 [email protected] Eu46.1mn) Total EV 13 Business Plan to 2018 Sostenya and Kinexia have approved a joint business plan for 2014-2018 that includes strategic guidelines. The plan has three focal points: i) renewable energy business; ii) environment management business; and iii) internationalisation. In more detail: i) Renewable energy business: the business plan goal is to develop, realise and manage diverse renewable energy production plants (solar, wind, cogeneration, waste, biomass and biogas) in a sustainable and competitive way. The company wants to focus on innovative technologies, products and services in the field of smart grids and smart cities, as well as energy storage. ii) Environment management business: the aim is that of an integrated management of special wastes to achieve full control of the waste chain, so as to be able to offer customised services for collection, transportation, selection, treatment and final disposal. Africa, Far East, China, India and Latin America – with the objective of developing new businesses (including joint ventures) in the environment and renewable energy fields. The company is aiming to achieve a 9.8% revenue CAGR from 2013 to 2018, thanks to: Smart energy with Innovatec, contributing up to 23% New approach in waste management (Westend) New acquisitions in waste treatment and landfills (Lafumet and Fornovo) Environmental services provided by subsidiary Faeco The business plan has been developed around the idea of building and maintaining a balanced mix of initiatives, some that should generate cash quickly (such as treatment plants) and other steadier and slower investments (such as landfills). 2013 Results, Before & After Merger* of Waste Italia (as illustrated in the business plan) Source: Company Business Plan As shown above, 2013 financials will increase on a pro-forma basis with the incorporation of Waste Italia Holding. However, Waste Italia Holding is burdened with Eu75mn in debt, of which Eu14mn is expected to be paid off by the end of 2014. The remainder is expected to be settled by 2016, at an average interest rate of 5.17% over the 2-year amortisation period. [email protected] iii) Internationalisation: the company is focusing on some key high-potential areas – North The combined 2013 revenue of Eu165mn is more than double Kinexia’s 2012 revenue of Eu62mn. Combined pro-forma EBITDA was Eu55.8mn, or 34% of sales; combined EBIT was Eu16.2mn in 2013 (16% of sales), vs. Kinexia’s Eu3.3mn in 2012. The Waste Italia Holding acquisition is expected to boost Kinexia’s revenues even further thanks to new landfill authorisations: one has been granted and the landfill will become active later this year, while another two are expected to be obtained in 2015. Source: Company Business Plan Revenues 2013 breakdown before & after merger (as per the business plan) Source: Company Business Plan The environment management business is the line that will influence overall revenue growth the most, going from Eu20mn pre-merger to Eu107mn post-merger, or from 26% to 65% of the total. The next largest business post-merger will be District Heating (from Eu24mn pre-merger to Eu25mn). 14 [email protected] Key 2013 Financial Ratios (as per the company business plan) 15 Source: Company Business Plan Kinexia’s revenues are expected to grow by 60% over the next five years. In 2018, the company expects to have an EBITDA margin of 29.9% and an EBIT margin of 16.2%. Net gearing (net debt divided by total assets) is expected to be 16.8% in 2018. [email protected] 2018 Business Plan Targets Key Financials: After Waste Italia Merger 2013 financial statement shows an actual value of production of Eu164mn. Post-merger EBITDA 2013 is Eu54.5mn (vs. Eu55.8mn declared in the plan). In our estimates, we forecast progressive revenue growth to reach Eu211mn in 2016, where Waste Italia is expected to contribute 47%. Energy Efficiency business will increase with CAGR of 47%, thanks especially to Innovatec. We estimate that EBITDA will increase 5% per year from 2013 to 2016, reaching Eu68mn. EBIT is estimated to rise by 24% to Eu32.7mn in 2016, with Waste Italia contributing 33% of the total in 2016. 2013 Net Profit is Eu3.6mn (vs. the company’s estimate of Eu3.8mn), and we estimate that the bottom line will be Eu14.5mn in 2016. (Eu mn) 2013A 2014E 2015E 2016E VALUE OF PRODUCTION 164.028 172.197 192.379 211.089 Cost of raw and consumable materials -29.305 -36.161 -36.552 -37.996 Cost of serv ice -57.765 -65.435 -69.256 -75.992 Labour Cost -15.882 -17.220 -19.238 -18.998 Other -6.578 -6.888 -7.695 -9.881 -142.867 Total Operating Costs -109.530 -125.704 -132.741 EBITDA 54.498 46.493 59.637 68.222 % Ebit da Margin 33,22% 27,00% 31,00% 32,32% Ammortization&Depreciation -29.325 -24.000 -30.000 -29.000 Prov isions -9.227 -4.000 -7.500 -6.500 EBIT 15.946 18.493 22.137 32.722 15,5% % Ebit Margin 9,7% 10,7% 11,5% Net Financials -9.508 -10.000 -9.600 -8.200 Pre tax Profit 7.337 9.293 13.337 25.322 % Pre Tax Profit 4,47% 5,40% 6,93% 12,00% Net Profit 4.381 5.095 7.056 14.841 GROUP NET PROFIT 3.648 4.795 6.756 14.541 % Net Margin 2,22% 2,78% 3,51% 6,89% Source: Intermonte estimates Note: All 2013 data are pro-forma Kinexia + Waste Italia Net Debt is also expected to improve from Eu178.7mn at the end of 2013 to Eu126.9mn in 2014 and then to Eu110.9mn at the end of 2016, thanks to Asset Disposal in 2014 for Biogas Plants (7MWp still in operation) 16 [email protected] Kinexia Group P&L 17 (Eu mn) 2013A 2014E 2015E 2016E Group Net Profit 3.648 4.795 6.756 14.541 Ammortization 29.325 24.000 30.000 29.000 Prov isions and Depreciation 9.227 4.000 7.500 6.500 -62.958 -1.819 -2.292 -8.546 Change in NWC Gross Operating Cash Flow -20.758 30.976 41.964 41.495 Capex -25.000 -19.000 -40.000 -26.000 FREE CASH FLOW -45.758 11.976 1.964 15.495 Change in Financial Assets -209 -230 -253 -279 Deferred Tax Assets Change -422 -464 -511 -562 Change in Participation 0 0 0 0 Acquisition/Disposal (net of debit) 0 40.000 0 0 -631 39.305 -764 -840 OTHER FIXED ASSETS CHANGES Share Capital Increase 0 0 6.000 0 Div idend 0 -1.174 -1.694 -2.310 TFR Changes 0 0 0 0 Sev erance & Other fund Changes 0 0 0 0 Deferred Tax Liabilities Change 0 0 0 0 -46.389 50.108 5.506 12.345 Initial Net Financial Position -65.456 -178.700 -128.592 -123.086 Final Net Financial Position -178.700 -128.592 -123.086 -110.741 -89350 -153646,13 -125839,12 -116913,35 NET CASH FLOW Av g NFP Source: Intermonte estimates Note: All 2013 data are pro-forma Kinexia + Waste Italia Source: Intermonte analysis [email protected] Kinexia Group - Cash Flow APPENDIX Sector Trends: Energy Sustainability in Italy Italy’s National Energy Strategy (SEN) The Italian Government’s guidelines to pursue energy sustainability are contained in a March 2013 report published by the Ministry for Economic Development. Significantly reduce the energy cost gap for consumers and businesses, by bringing prices and costs in line with European levels by 2020 and ensuring that the longer-term energy transition (2030-2050) will not compromise Italian and European industrial competitiveness. Achieve and exceed the environmental and decarbonisation targets established by the European Union’s 2020 Climate and Energy Package (known as the “20-20-20” package) and take on a lead role in defining and implementing the Roadmap 2050. Improve security of supply, especially in the gas sector, and reduce dependency on imports. Foster sustainable economic growth by developing the energy sector, especially “green” energy, to tap into a huge potential (the IEA estimates $38 trillion in global investment by 2035). In the medium term (up to 2020), the Government has 7 main goals, namely: 18 Energy efficiency: by reducing emissions and improving security of supplies by reducing dependency on foreign countries Gas market competitiveness: create an internal market that is fully integrated with other EU countries; there is an opportunity for Italy to act as a crossroads for gas entering Europe from Africa Sustainable development of renewable energy: Italy aims to beat Europe’s 20-20-20 goal and reduce emissions; the Government believes investing in the renewable energy sector will help spur economic growth in general Improve electricity infrastructure: improve the market to make it free, efficient, totally integrated with the rest of Europe in terms of both infrastructures and regulations and at prices that should be in line with other European countries Restructuring the refining industry and the fuel distribution sector: profound restructuring is needed in these industry areas, and this could lead to more competitive and technologically advanced assets Sustainable domestic production of hydrocarbons: leverage more on the country’s oil and gas reserves, while paying the utmost attention to potential environmental impact of production Modernise governance: Italy needs to make its decisional processes more efficient, as procedures are often lengthy and complicated; a shared national energy strategy that is clear to everyone is the first important step in this direction [email protected] The Government’s main long-term objectives (to be achieved by 2050) are: 19 The role and the potential of energy efficiency in Italy The Government’s top priority for 2020 is energy efficiency, which is indeed the most important from a cost/benefit perspective. According to the SEN report, the country can save Eu9bn/year in Source: SEN The Government estimates that energy efficiency will act as leverage for investments to the tune of Eu50-60bn by 2020, about 40% of which will be supported by incentives. In the renewable energy field, cumulated investments are estimated at Eu60-70bn, of which 60% linked to incentives. Cumulated investments to 2020 (in billion euros) Source: SEN The main goal of these energy efficiency initiatives is to reduce energy consumption by 24%. Consequently, this implies an Eu8bn annual reduction in costs for Italian imports (or Eu62bn over the entire timeframe). [email protected] electricity and gas bills. The transport business accounts for the largest share of Italy’s energy consumption (32%), followed by the residential and service sectors (23% and 12-13%), while public bodies consume about 2-3% of the total. Energy Consumption in Italy, 2010 (figures are percentages of the total) Source: SEN Overall, “civic” usage represents 40% of total consumption. It is evident that the majority of investments made from now to 2020 will be concentrated in the civic sectors (around Eu50-60bn). The company has outlined a five-year growth strategy involving all business segments as part of its business plan. 20 [email protected] Source: SEN Source: Intermonte on company data [email protected] 21 DISCLAIMER (for more details go to http://intermonte.it/ disclosures.asp) IMPORTANT DISCLOSURES The reproduction of the information, recommendations and research produced by Intermonte SIM contained herein and of any its parts is strictly prohibited. None of the contents of this document may be shared with third parties without authorisation from Intermonte. This report is directed exclusively at market professional and other institutional investors (Institutions)and is not for distribution to person other than “Institution” (“Non-Institution”), who should not rely on this material. Moreover, any investment or service to which this report may relate will not be made available to Non-Institution. The information and data in this report have been obtained from sources which we believe to be reliable, although the accuracy of these cannot be guaranteed by the Intermonte. In the event that there be any doubt as to their reliability, this will be clearly indicated. The main purpose of the report is to offer up-to-date and accurate information in accordance with regulations in force covering “recommendations” and is not intended nor should it be construed as a solicitation to buy or sell securities. This disclaimer is constantly updated on Intermonte’s website www.intermonte.it under DISCLOSURES. Valuations and recommendations can be found in the text of the most recent research and/or reports on the companies in question. GUIDE TO FUNDAMENTAL RESEARCH Reports on all companies listed on the S&PMIB40 Index, most of those on the MIDEX Index and the main small caps (regular coverage) are published at least once per quarter to comment on results and important newsflow. A draft copy of each report may be sent to the subject company for its information (without target price and/or recommendations), but unless expressly stated in the text of the report, no changes are made before it is published. Explanation of our ratings system: BUY: stock expected to outperform the market by over 25% over a 12 month period; OUTPERFORM: stock expected to outperform the market by between 10% and 25% over a 12 month period; NEUTRAL: stock performance expected at between +10% and – 10% compared to the market over a 12 month period ; UNDERPERFORM: stock expected to underperform the market by between –10% and -25% over a 12 month period; SELL: stock expected to underperform the market by over 25% over a 12 month period. The stock price indicated is the reference price on the day prior to the publication of the report. CURRENT INVESTMENT RESEARCH RATING DISTRIBUTIONS Intermonte SIM is authorised by CONSOB to provide investment services and is listed at n° 246 in the register of brokerage firms. As at June 30th 2014 Intermonte’s Research Department covered 146 companies. Intermonte’s distribution of stock ratings is as follows: BUY: 20.13% OUTPERFORM: 34.42% NEUTRAL: 44.15% UNDERPERFORM: 1.30% SELL: 0.00% The distribution of stock ratings for companies which have received corporate finance services from Intermonte in the last 12 months (31 in total) is as follows: BUY: 21.88% OUTPERFORM: 43.75% NEUTRAL: 34.37% UNDERPERFORM: 0.00% SELL: 0.00% CONFLICT OF INTEREST In order to disclose its possible conflicts of interest Intermonte SIM states that: o within the last year, Intermonte SIM managed or co-managed/is managing or is co-managing (see companies indicated in bold type) an Institutional Offering and/or , managed or co-managed/is managing or is co-managing (see companies indicated in bold type) an offering with firm commitment underwriting of the securities of the following Companies: Ascopiave, Banca Ifis, Banca Carige, Banca Popolare di Sondrio, Creval, Fincantieri, GreenItaly1, MPS, Poltrona Frau, Salini Impregilo, Tecnoinvestimenti, Triboo Media. o Intermonte SIM is Specialist and/or Corporate Broker and/or Broker in charge of the share buy back activity of the following Companies: Banca Etruria, Banca Ifis, Be, Biancamano, B&C Speakers, Bolzoni, Carraro, Cattolica Assicurazioni, Credito Valtellinese, Datalogic, DeA capital, Digital bros, EL.En, ERG, Ferrovie Nord Milano,Milano, Fiera Milano, Fintel Energia Group, Gefran, GreenItaly1, IGD, Innovatec, Kinexia, Mondo TV, Primi sui Motori, QF Alpha Immobiliare, QF Beta Immobiliare, Recordati, Reno de Medici, Reply, Saes Getters, Servizi Italia, Sesa, Snai, Tamburi Investment Partners, TESMEC, TBS Group, Ternienergia, TXT e-solutions, Vittoria Assicurazioni, VRWay Communication. o Intermonte SIM acted as Global Coordinator in the GreenItaly1 IPO on the AIM Italia market and will receive a success fee if a business combination is approved by the shareholders. o Intermonte SIM SpA and its subsidiaries do not hold a stake equal to or over 1% of common equity securities and/or warrants of any of the aforementioned subject companies, with the exception of: GreenItaly1. o Intermonte SIM SpA has provided in the last 12 months / provides / may provide investment banking services to the following companies: Atlantia, Carraro, Kinexia, RCS Media, Saes Getters DETAILS ON STOCKS RECOMMENDATION Stock NAME KINEXIA Current Recomm: OUTPERFORM Previous Recomm: OUTPERFORM Current Target (Eu): 2.70 Previous Target (Eu): 1.80 Current Price (Eu): 2.26 Previous Price (Eu): 1.62 Date of report: 15/07/2014 Date of last report: 13/11/2013 © Copyright 2010 by Intermonte SIM - All rights reserved It is a violation of national and international copyright laws to reproduce all or part of this publication by email, xerography, facsimile or any other means. The Copyright laws impose heavy liability for such infringement. The Reports of Intermonte SIM are provided to its clients only. If you are not a client of Intermonte SIM and receive emailed, faxed or copied versions of the reports from a source other than Intermonte SIM you are violating the Copyright Laws. This document is not for attribution in any publication, and you should not disseminate, distribute or copy this e-mail without the explicit written consent of Intermonte SIM. INTERMONTE will take legal action against anybody transmitting/publishing its Research products without its express authorization. INTERMONTE Sim strongly believes its research product on Italian equities is a value added product and deserves to be adequately paid . Intermonte Sim sales representatives can be contacted to discuss terms and conditions to be supplied the INTERMONTE research product. INTERMONTE SIM is MIFID compliant - for our Best Execution Policy please check our Website www.intermonte.it/mifid Further information is available 22 [email protected] ANALYST CERTIFICATION For each company mentioned in this report the respective research analyst hereby certifies that all of the views expressed in this research report accurately reflect the analyst’s personal views about any or all of the subject issuer (s) or securities. The analyst (s) also certify that no part of their compensation was, is or will be directly or indirectly related to the specific recommendation or view in this report. The analyst (s) responsible for preparing this research report receive(s) compensation that is based upon various factors, including Intermonte’s total profits, a portion of which is generated by Intermonte’s corporate finance activities, although this is minimal in comparison to that generated by brokerage activities. Intermonte’s internal procedures and codes of conduct are aimed to ensure the impartiality of its financial analysts. The exchange of information between the Corporate Finance sector and the Research Department is prohibited, as is the exchange of information between the latter and the proprietary equity desk in order to prevent conflicts of interest when recommendations are made.
© Copyright 2026 ExpyDoc