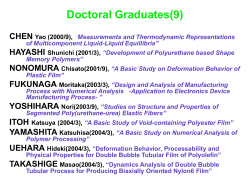
Using Iterative Learning Control with Basis Functions to Compensate Medium Deformation in a Wide-Format Inkjet Printer Joost Bolder1 , Tom Oomen1 , Sjirk Koekebakker2 , Maarten Steinbuch1 1 Eindhoven University of Technology, Dept. of Mechanical Engineering, Control Systems Technology group, P.O. Box 513, 5600 MB Eindhoven, The Netherlands, mail to: [email protected] 2 Oc´e Technologies, P.O. Box 101, 5900 MA Venlo, The Netherlands Abstract The increase of paper size and production speed in wide-format inkjet printing systems is limited by significant in-plane deformation of the paper during printing. To increase both the production speed and paper size, the compensation of paper deformation is essential. A potential approach to compensate the paper deformation is actively changing the longitudinal paper position during a lateral pass of the printheads. This paper aims at developing an Iterative Learning Control (ILC) algorithm suited for this compensation strategy. The paper position is measured directly, but in non-real-time using image data obtained with a scanner located at the printheads. The proposed controller is experimentally validated and compared with standard norm-optimal ILC in a reproducible experiment where a set of benchmark trajectories is used that represents severe paper deformation. The results show that in contrast to standard ILC, the ILC with basis functions achieves good tracking performance for reference set and is hence a proper candidate for the compensation strategy. Keywords: ILC, Basis functions, Optimal control, Visual servoing, Varying references 1. Introduction The increase of production speed and paper size for wideformat inkjet printing systems is limited by significant deformation of the paper during printing [34]. This deformation affects the alignment of print-passes and also distorts the printed image. In present commercial systems, this is one of the reasons for introducing more than 50% overlap between passes. The overlap mitigates the effects on the print quality, but as a result, significantly reduces the production speed. To increase both the paper size and production speed, the compensation of these deformations is required. A potential approach to compensate the paper deformation is actively changing the longitudinal paper position during a lateral pass of the carriage [4]. The shape of the deformation gradually changes in time [34], and therefore the reference trajectory for the paper motion must also change each pass. In [4], only measurements of the motor motor position were used for control. Despite the significant performance enhancement at the motor side, an evaluation at the paper revealed insufficient performance. Although the approach in [4] is conceptually promising, the disturbances introduced by the medium position drive [15] cannot be suppressed by applying control using the measured motor position. Therefore, in the present paper, the use of a newly developed scanner in the control loop is proposed. This scanner is located in the carriage (that holds the printheads), and is used to directly measure the longitudinal paper position. The measurements results from an image processing algorithm that Preprint submitted to Mechatronics analyzes each scan offline. Iterative Learning Control (ILC) updates the command signal offline in a batch-to-batch fashion and is hence well-suited to be used in combination with the offline measurements. Although ILC is known to achieve very good tracking performance, the learned command signal is optimal for a specific task only [5], extrapolation to other tasks can lead to significant performance degradation [33, 17]. In [21], a segmented approach to ILC is presented and applied to a wafer stage. This approach is further extended in [16], where the complete task is divided into subtasks that are learned individually. The use of such a signal library is restricting in the sense that the tasks are required to consist of standardized building blocks that must be learned a priori. The use of a time-varying robustness filter [6, 29] introduces extrapolation capabilities for specific filter structures [29], but only for a restricted class of reference variations. In [12] an initial input selection for ILC is proposed. This method can be used to reinitilize the ILC after a reference change, see the related results in [17]. The re-initialiation mapping is only static, hence modeling errors directly affect the extrapolation capabilities. In [8] an ILC algorithm for LPV systems is proposed. The approach deals with the varying dynamics and introduces extrapolation capabilities for different initial positions of the system. In [32, 33, 22], basis functions in ILC are introduced. In [22], the tracking errors are projected onto a basis in order to only learn the repetitive part of the tracking error. In [33], the ILC command signal is parameterized using basis functions, in order to achieve extrapolation capabilities. The difference 10/06/2014 between these two approaches is projecting either the measured output onto a basis, or, construct the ILC command signal from a basis; both approaches can be encompassed in the framework presented in [32]. In this paper, basis functions are used that enhance the extrapolation properties in ILC. Potentially, this method achieves improved performance and extrapolation capabilities simultaneously. The earlier approach in [4] cannot be applied i directly since the controller structure is not suitable for the additional non-real-time measurements, moreover, the extrapolation capai bilities are not investigated. The results in [5] employ a more complex set of basis functions than considered here, to further increase performance and extrapolation capabilities. These results however, lack experimental validation and are more suited for a different class of systems than considered in this paper. The main contribution of the present paper is the design and experimental implementation of an iterative learning controller [7, 9, 23], in which the varying references and offline position measurements are explicitly addressed. An experimental comparison of the proposed ILC with standard norm-optimal ILC in a reproducible validation experiment is presented. A set of benchmark references is employed that represents severe paper deformation. The key result is that the ILC with basis functions achieves good tracking performance that is insensitive to the changes in reference, in contrast to standard ILC. This paper is organized as follows. First, the problem that is addressed in this paper is defined in detail in Section 2. The experimental setup and paper position measurements are elaborated on in Section 3, followed by the presentation of the learning controller framework in Section 4. Finally, the controller design and experimental results are elaborated on in Section 5. pass paper carriage ion rect i d t por ans r t er “deformations˙temp” —ap2014/2/6 — 14:36 — page 1 — #1 p Figure 1: Mono-directional printing, the paper is printed on during each from left-to-right pass of the carriage. The paper is transported with a fixed step size after a pass is completed 0s 71.6 s 143.2 s 214.8 s 286.4 s 358 s 429.6 s 0 Ca 0.2 rri ag e d 0.4 ire ct io n ec 0.1 dir t r sp o ra n 0.2 0.6 → [m 0 ] 0.8 p Pa er t 0.3 0.4 0.5 tio 0.6 n→ m [m ] Figure 2: Measured paper deformation. Each line represents the paper deformation with respect to a straight line for a certain time instance, the time is indicated by the colorbar. 2. Problem formulation 2.2. Paper deformations In this section, the addressed problem is defined. First, in Section 2.1, the printing process is introduced. Then, in Section 2.2, the paper deformations that arise during the printing process are explained. Finally, the problem statement is formulated in Section 2.3. The printing process typically introduces temperature and moisture changes in the paper [34]. In the printing process used, temperature increase is caused by the use of a heated printsurface, and the use of molten ink. The ink is molten inside the printheads and crystallizes on the paper after printing. This drastically increases the paper temperature, that in turn leads to the evaporation of moisture that was already present in the paper before printing. These changes in temperature and moisture content in turn lead to deformation of the paper. The measured paper deformation for 145 passes of the carriage is shown in Fig. 2 (the measurement procedure is elaborated on detail in Section 3.2). Each line represents the deformation position with respect to a straight line for a certain time instance, indicated by the colorbar. It shows that the paper suffers from planar deformation that gradually evolves into a parabolic-like shape as time progresses. The deformation evolves unidirectional and the magnitude is in the order of 600 µm. The scale of this deformation is large enough to severely deteriorate the print quality [28], especially when production 2.1. Scanning printing process Figure 1 shows an overview of the so-called scanning printing process. The medium, e.g. paper, is printed on by the printheads that are located in the carriage. The carriage moves from left-to-right and vice versa, and each time such a pass completes the paper is translated with a fixed step size. In the present paper the mono-directional printing process is used. This means that the printheads only print when the carriage is moving from left-to-right, indicated with the arrow, see Fig. 1. The results in this paper are also applicable to bi-directional printing, the main differences are tighter requirements on the computational cost of the algorithm and larger changes in the reference trajectories. i 2 i deformed passes z Carriage carriage Figure 3: Misalignment of passes due to the paper deformation. The longitudinal paper position is denoted as z [m]. Paper speed is maximized and no overlap between the passes is used. Figure 3 shows how the paper deformation negatively affects the alignment of passes. It shows that at the edges of a pass there may be overlap, in contrast to the center of the pass, that aligns properly with the previous pass. Proper alignment leads to improved print quality, and is hence pursued. 2.3. Problem formulation Print surface The main idea is to compensate the misalignment by actively changing the longitudinal paper position z, see Fig. 3, during a pass of the carriage (which is lateral to the paper transport direction). The deformation measurement in Fig. 2 shows that the shape of the deformation gradually changes as time progresses. Consequently, to correct the misalignments effectively, the reference trajectory for the paper position must also change each pass of the carriage. A scanner in the carriage is used to directly measure the longitudinal paper position z, see Fig. 3. The direct measurement allows to control disturbances introduced by the medium positioning drive. The position measurements result from an image processing algorithm that analyzes each scan offline. To compensate the misalignments, a control algorithm that meets the following requirements is necessary: Figure 4: Overhead view of the wide-format printer: the carriage, paper, and print surface are indicated. 3. Experimental setup R1. the use of offline batch-wise measurements As stated in the problem formulation, the objective is to design a controller meeting requirements R1 and R2 and to validate the design in a reproducible benchmark experiment. Therefore, a measurement procedure is developed that eliminates the deformation of the paper from the displacement measurement. Moreover, reference trajectories are designed that represent severe paper deformations to use in the validation experiment. First, the experimental setup is discussed, followed by the paper displacement measurement procedure using the scanner, and finally the benchmark trajectories are introduced. R2. allow variation in the reference trajectory 3.1. Setup The main contribution of the present paper is the design of an iterative learning controller with basis functions that addresses these requirements. ILC updates the command signal offline in a batch-to-batch fashion and hence naturally meets requirement R1. Suitable basis functions [32, 4] are introduced to deal with the varying reference trajectories that are required for R2. The controller design is experimentally validated and compared with standard norm-optimal ILC in a reproducible experiment where a set of benchmark trajectories is used. It is expected that the control algorithm is suitable for the actual compensation of paper deformation if these benchmark references can be accurately followed with the paper position. The implementation aspects of the compensation strategy during actual printing instead of a benchmark experiment are discussed in Section 5.3. In the next section the wide-format printer setup and benchmark references are discussed. The wide-format printer is depicted in Fig. 4. The carriage, print surface, and paper are indicated. The medium positioning drive (MPD) is located internally and hence not visible in Fig. 4, instead, a diagram of the MPD is shown in Fig. 5. The MPD includes a motor that drives the rollers, and the rollers are used to position the paper. The motor is voltage driven and the rotor position y [m] is measured using an optical encoder. The gear ratio from motor to the roller is 60:1, and the roller position x [m] is measured by another optical encoder. The paper position z [m] is measured using a scanner located inside carriage. The measurement procedure is presented in the next section. 3.2. Paper position measurement procedure To improve reproducibility of the experimental results, a twoscan measurement procedure is used. The objective is to eliminate the effects of paper deformation from the position mea3 rollers carriage paper input, u scanner, z print surface transport direction encoder, y encoder, x motor worm gear Figure 5: Side view of the medium positioning drive: the motor is voltage driven with input u, its rotor position y is measured with an optical encoder. The paper is positioned using the indicated rollers, the bottom roller with position measurement x is driven by the motor. The carriage moves perpendicular to the plane of the diagram, the scanner in the carriage is used to measure the paper displacement z. surement such that a proper benchmark experiment can be performed. An overview of the paper position measurement procedure is shown in Fig. 6. Straight marker-lines have been printed a priori followed by a wainting period of 5 minutes. After the waiting period, the marker lines are scanned each time the carriage passes from left to right. In contrast to the printing process illustrated in Section 2.1, the paper is not shifted after a pass of the carriage, hence during each pass the same lines are scanned. The paper position z is measured is as follows: Illustration of the scanning process: (a) paper motion scanner marker 1. the marker lines are scanned without motion of the paper (r = 0), see Fig. 6 (b), Scan image result, without paper motion during scan: (b) 2. the marker lines are scanned with motion of the paper during the scan (i.e, some reference r is applied), see Fig. 6 (c), 3. the image processing algorithm (see Appendix A) deteri mines the position of the marker lines in the image for each scan separately, this results in two position signals, i that are a function of time, Scan image result, with paper motion during scan: (c) “displacement˙temp” — 2014/2/17 — 14:52 — page 1 — #1 4. the resulting paper displacement is computed by subtracting the marker position for the scan without motion from the scan with motion. Computed paper position z: (d) 0.6 z [mm] The straightness of marker lines has been affected by the paper deformation in both images, this is especially visible in Fig. 2 (b). Since both scans are affected by the same deformation, the deformation cancels out when subtracting the marker position signal of Fig. 2 (c) from Fig. 2 (b), resulting in the paper displacement depicted in Fig. 2 (d). The paper deformation in Fig. 2 is measured by repeatedly scanning the marker lines with r = 0 and using the algorithm in appendix A to compute the position of the marker. Right after the marker has been printed, the lines are straight. As the paper deforms while time passes, the shape of the marker changes; eventually yielding the results presented in Fig. 2. 0.4 0.2 0 −0.2 0 0.2 0.4 0.6 0.8 1 Time [s] Figure 6: Paper position measurement procedure. The scanner records the marker-lines during each left-to-right pass of the carriage (a). The resulting images of two scans: one without motion of the paper during the scan (b) and one with a forward-backward and consecutive backward-forward motion of the paper during the scan (c), the paper position computed from the two scans by the image processing algorithm (d). 3.3. Benchmark references The measurement procedure developed in the previous section eliminates deformation in the paper from the displacement 4 i “referencesExp˙temp” — 2013/8/27 — 13:00 — page 1 — #1 −4 with 0 ≤ t < n, and zero initial conditions. This finite-time convolution is recast to the so-called lifted notation [7]: y[0] h(0) h(−1) ... h(1−n) u[0] y[1] h(1) h(0) ... h(2−n) u[1] , . .. = . . . . . . .. . . .. h(n−1) h(n−2) ... h(0) u[n − 1] y[n − 1] {z } | {z } | {z } | x 10 5 r [m] 4 3 2 1 H y 0.1 0.15 0.2 0.25 0.3 0.35 Time [s] Figure 7: The benchmark references: r1 (solid black), r2 (dashed red), r3 (dashed-dotted blue). 4.2. Feedback controller structure The control setup is shown in Fig. 8. The process is the MPD, and is indicated in shaded gray. During an experiment with index j, the motor position y j and the paper displacement z j are measured. The feed forward is denoted as f j and the reference is denoted as r. The feedback controller C is applied over the motor position y j , since z j is measured offline and therefore not available for real-time feedback. In ILC, the learning update is typically calculated offline, hence the measured paper displacement z j is well-suited to be used for ILC. A consequence of using this strategy is that the ILC optimizes the tracking error measured at the paper: measurement. A set of reference trajectories is used as benchmark to validate the controller design in a reproducible experiment. As mentioned in problem formulation, see Section 2.3, it is expected that the candidate control algorithm is suitable for the actual compensation of paper deformation if these benchmark references can be accurately tracked with the paper position. The set of trajectories r1 , r2 and r3 is presented in Fig. 7. These 4th order polynomial references represent severe paper deformations and are inspired by the paper deformation measurements shown in Fig. 3, where the focus is on the first half of the deformation shape. The size of the trajectories is in the same order of magnitude as the deformations and the distance increases each consecutive reference. During experiments, the active reference is selected from this set of references r ∈ {r1 , r2 , r3 }. ezj = r − z j with S the convolution matrix of the sensitivity (1+CPy )−1 . The feedback controller C operates on the tracking error measured at the motor: eyj = r˜ − y j = S r˜ − Py S f j . (2) eyj Essentially, the performance variables and ezj may be conz y flicting, depending on P and P . Therefore the filter In this section, the controller structure, feedforward parameterization and ILC with basis functions framework are presented. The following notation is used. A discrete-time system is denoted as H. The ith element of a vector θ is expressed as θ[i]. A matrix A ∈ Rn×n is defined positive definite iff xT Ax > 0, ∀x ∈ Rn and is denoted as A 0. For a vector x ∈ Rn , the weighted 2-norm is ||x||W = xT W x, with W 0 ∈ Rn×n the weighting matrix. Py r (3) Pz is introduced, see Fig. 8, and is a special choice of a two-degreeof-freedom controller structure for inferential servo control [24, 25]. The following illustrates that this filter aligns the performance variables eyj and ezj . Suppose the ILC achieves perfect performance by learning from ezj , reaching ezj = 0. Substituting the latter in (1) and solving for f j yields: r˜ = f j = (Pz )−1 r i 4.1. Finite-time ILC framework All signals and systems are discrete time and often implicitly assumed of length n. Systems are assumed to be linear timeinvariant, and single intput single output. Given are a system H and finite-time input and output vectors u, y ∈ Rn×1 . Let h(t), t ∈ Z be the infinite-time impulse response vector of H. Then, the finite-time response of H to u is given by the truncated convolution y[t] = (1) = r − Pz S f j − PzCS r˜, 4. Norm-optimal iterative learning control with basis functions t X u with H the convolution matrix corresponding to system H and y = Hu the finite time response. Note that H is not restricted to be a causal system, otherwise h(t < 0) = 0. 0 0.05 i i (4) Subsequent substitution of (4) and (3) in (2) yields eyj = 0 hence, the feedback controller is not conflicting with the ILC if reference filter is used. Substituting the reference filter (3) in the tracking errors (1) and (2) yields: ezj = S r − Pz S f j . y (5) P r − Py S f j , Pz If Pz has zeros outside the unit-disc, the stable-inversion approach in [11] can be adopted to compute r˜. eyj = S h(l)u[t − l], l=1−n 5 fj r P y r˜ Pz − eyj uC j C MPD uj Pz Py norm-optimal ILC framework, where the feedforward is generated using a set of basis functions. The optimization criterion for the present paper defined as follows. zj yj Definition 1 (Norm-optimal ILC with basis functions). The optimization criterion for norm-optimal ILC with basis functions is given by Figure 8: Control setup, with the MPD is indicated in shaded gray and reference filter Py (Pz )−1 . Learning update r P Pz eyj r˜ C (7) with We 0, W f , W∆ f 0, and f j+1 = F(θ j+1 )r. θj F (θj ) y J(θ j+1 ) := ||ezj+1 ||We + || f j+1 ||W f + || f j+1 − f j ||W∆ f , fj uC j In (7), We 0, and W f , W∆ f 0 are user-defined weighting matrices to specify performance and robustness objectives [27], namely, robustness with respect to model uncertainty (W f ) and convergence speed and sensitivity to trial varying disturbances (W∆ f ). The tracking error at the paper for trial j + 1, i.e., ezj+1 , is used in cost function (7), and is given by: MPD uj − Pz Py zj yj ezj+1 = ezj − Pz S F(θ j+1 ) − F(θ j ) r Figure 9: Control setup with feedforward parameterization F(θ j ) and the ILC learning update generating θ j . The latter follows from eliminating S r in (6) and using e j+1 = S r − Pz S F(θ j+1 )r, yielding the error propagation from trial j to j + 1. The feedforward-parameter update is given by 4.3. Feed forward parameterization θ∗j+1 = arg min J(θ j+1 ). As argued in the problem formulation, see Section 2.3, requirement R2 necessitates a control algorithm with the ability to track a class of references. Therefore, a parameterization is introduced that incorporates extrapolation capabilities in the feedforward with respect to the reference. The following illustrates that the essence of obtaining the ideal feedforward command signal lies in choosing f j to be a function of r. Let f j = F(θ j )r, with F(θ) the convolution matrix of a linear system with parameters θ j . The particular structure of F(θ) remains to be chosen, and is discussed in Section 4.4. Subsequent substitution of f j into (5) yields ezj = S r − Pz S F(θ j )r = I − Pz F(θ j ) S r. θ j+1 (8) The optimization criterion (7) is a quadratic function in ezj+1 and f j+1 , the dependence of J on the feed forward parameters θ j is determined by the structure of the feedforward parameterization F(θ j ). In the present paper, F(θ j ) is chosen linearly in θ j , such that ezj+1 is linear in θ j . Consequently, the performance criterion (7) is quadratic in θ j+1 and hence an analytic solution to (8) exists [5, 33]. The structure of F(θ j ) is part of the controller design and presented in Section 5.1. Given models Pz and S = (I + CPy )−1 , basis functions Ψ = ∂θ∂ j F(θ j )r, with Ψ ∈ Rn×m full column rank, here, m is the number of parameters θ j ∈ Rm , and weighting matrices We , W f s.t. (Pz )T S T We Pz S + W f 0, then the parameter update that minimizes J(θ j+1 ), see (7), is given by (6) Equation (6) reveals that if the feedforward is parameterized in terms of the reference r, then the error in (6) can be made invariant under the choice of r, given that F(θ j ) = (Pz )−1 , yielding ezj = 0. This implies that if the latter is satisfied, perfect extrapolation properties with respect to r are obtained. The introduced feed forward parameterization F(θ j ) is incorporated in the controller structure and shown in Fig. 9. θ j+1 = Lezj + Qθ j , h L = ΨT (Pz )T S T We Pz S + W f + i−1 h i W∆ f Ψ ΨT (Pz )T S T We , (9) h T z T T z Q = Ψ (P ) S We P S + W f + i−1 W∆ f Ψ ΨT (Pz )T S T We Pz S + W∆ f Ψ, 4.4. Extending norm-optimal iterative learning control with basis functions with L and Q the learning filters and f j+1 = Ψθ j+1 . Learning update (9) leads to monotonic convergence of || f j ||, for properly selected weighting matrices We , W f and W∆ f . The learning filters are obtained following the same lines as in standard normoptimal ILC, e.g., [14] and is based on the necessary condition for optimality ∂θ∂Jj+1 = 0, and solving this linear equation for θ j+1 , yielding the parameter update in (8). In this section, the norm-optimal learning update algorithm is discussed that addresses the computation of f j+1 from the measurement ezj . Norm-optimal ILC is an important class of ILC algorithms, e.g., [1, 20, 14, 2, 18], where f j+1 is determined from the solution of an optimization problem. Norm-optimal ILC with basis functions [4, 5, 33, 32] is an extension of the 6 i i “ExpFrf˙temp” — 2013/8/15 — 15:35 — page 1 — #1 −80 Magnitude [dB] Remark 1. The effects of non-minimumphase zeroes in the system, i.e., Pz S on a norm-optimal ILC algorithm are reported in [10]. It is shown that for sufficiently long trial length n, this convolution matrix has a number of extremely small singular values that are associated with arbitrary slow convergence for a part of the tracking error. When basis functions are introduced, the system Pz S ∈ Rn×n can be reduced to a system Pz S Ψ ∈ Rn×m , with typically m << n. The basis functions Ψ can be chosen such that the small singular values are be eliminated. Hence, fast convergence can be obtained, although typically ezj→∞ , 0. −100 −120 −140 −160 Px −180 −90 Phase [◦ ] −180 Remark 2. The introduction of basis functions greatly reduces the numerical costs of the ILC algorithm. In standard normoptimal ILC with trial length n, the basis functions Ψ = I ∈ Rn×n in (9). The matrices L ∈ Rn×n and Q ∈ Rn×n . With m basis functions, Ψ ∈ Rn×m , consequently, L ∈ Rm×n and Q ∈ Rm×m . Typically m << n, hence a major reduction of computational cost is achieved. −270 −360 −450 −540 Magnitude [dB] −80 5. Experimental results −100 −120 −140 −160 Py −180 −90 The controller design steps are presented in Section 5.1, followed by the presentation of the experimental results in Section 5.2. Phase [◦ ] −180 5.1. Iterative learning controller design −270 −360 −450 −540 The proposed controller design encompasses three steps: 1 10 1. system identification, 2 10 Frequency [Hz] 2. selection of the feedforward parameterization, y x (top, solid black) and P Figure 10: Frequency response measurement Pfrf frf (bottom, solid black), 3σ (99.7%) confidence intervals (shaded gray), models x y P (top, dashed red) and P (bottom, dashed red). 3. design of the weighting matrices. Each step is presented in the following. [30]. The Bode diagrams of Pfrf , P and the 3σ (99.7%) confidence interval of Pfrf are shown in Fig. 10. The results show that the uncertainty region is large for higher frequencies, where the uncertainty for P x starts increasing significantly at 230 Hz and at 400 Hz for Py . Both uncertainty regions could be caused by a poor signal-to noise ratio, the difference in frequencies could stem from the use of different optical encoders, the encoder for x has a slightly lower resolution than the encoder used to measure y. The identified model P corresponds well with the measurement for frequencies up to 200 Hz, for higher frequencies the magnitude of P x is larger than the magnitude of Pfrf . The model includes 5 common poles (i.e., P x and Py , see Fig. 9, have the same 5th order denominator polynomial), and each output has 4 associated zeros (i.e., P x and Py have different 4th order numerator polynomials). The sensitivity S = (1 + CPy )−1 is calculated using the already existing feedback controller C, see Appendix B for more details. Step 1, system identification To calculate the learning filters L and Q, models Py and Pz are required, see Section 4. Instead of performing system identification for Pz by using the scanner, the encoder that measures the roll position x is used, see Fig. 5. It is assumed that Pz = P x . The modeling error introduced by this assumption is expected to be small, and consequently, the convergence properties of the ILC remain unaffected. i Open-loop system identification is performed to identify P = [P x , Py ]T . The system is excited with Gaussian noiseisince it is the only available excitation signal in the experimental setup. The input is the motor voltage u, the outputs are motor position y and roller position x, see Fig. 5. The sampling frequency f s = 1 kHz is given. The frequency response function (frf) Pfrf is estimated using the procedure in [26, Section 3.3.3]. A Von Hann window is used to deal with leakage effects. The obtained frequency resolution is 0.5 Hz. The frequency response measurement Pfrf results from 400 averaged measurement blocks to reduce the variance on Pfrf . The parametric model P is estimated using an iterative identification procedure, as e.g. in Step 2, feedforward parameterization As argued in Section 4.3, the feedforward parameterization should be such that F(θ j ) = (Pz )−1 . The idea is to deduce a suit7 able structure for F(θ j ) using the measured frequency response x for the roller Pfrf and physical insight in the MPD, see Fig. 5. x Analysis of the Bode diagram of Pfrf , see Fig. 10 (top), reveals that at least six poles and two zeros are present: similar. If large reference variations are expected, a broadband training reference can be used in order to obtain close resemblance between F(θ j )−1 and Pz , hence, achieving good tracking performance for the large reference variations as well. 1. Two stable real-valued poles at frequencies below 40 Hz, indicated by both the −2 slope of the magnitude and the phase approaching −180◦ . These poles capture the rigid-body dynamics, viscous friction, and counterelectromotive force of the DC-motor. Step 3, weighting matrices The weighting matrices in Definition 1 specify the performance and robustness objectives. As illustrated in Section 4.3 with (6), optimal extrapolation properties and tracking performance is achieved simultaneously when F(θ j ) = (Pz )−1 . In view of (6), this corresponds with minimizing ezj+1 in the cost function (1). Hence, ideally W f = 0. Since W f > 0 is necessary for increased robustness against modeling errors, this may be impossible to achieve in practice. The obtained values presented here result from an iterative tuning procedure, where convergence speed, the trade-off between performance and robustness, and numerical conditioning are balanced. First, We = I · 106 , W∆ f = 0, and W f = Ic1 with c1 >> 1 a constant. Then, experiments are performed, where c1 is gradually lowered. The model presented in Section 5.1 step 1 turned out to be accurate enough to set W f = 0. Then, W∆ f = Ic2 , with c2 = 0. In the following experiments c2 is gradually increased until the variation due to non-repetitive disturbances is at a satisfactory level, while maintaining a good convergence speed. The final weighting filters are given by 2. Two stable complex-conjugated poles at 94 Hz, indicated by the peaking magnitude and the phase-loss of 180◦ . These poles capture the resonance phenomenon between the roller and DC-motor. 3. Two minimum-phase complex-conjugated zeros creating the anti-resonance at 115 Hz, indicated by the small dip in magnitude and the phase-increase. 4. Two stable complex-conjugated poles creating the resonance at 119 Hz, indicated by the small peak in magnitude and the phase-loss. These poles, in combination with the zeros at 115 Hz are attributed to relatively flexible connection of the encoder that measures the roller position x to the roller, see Fig. 5. The anti-resonance and resonance phenomenon caused by the roller-encoder is ignored since it relatively small in comparison with the other dynamics. This implies that the feed forward structure should include 4 zeros, and no poles. The structure of F(θ j ) is therefore selected as follows: let ξ(z) = f s (1 − z−1 ) be a differentiator with convolution matrix ξ, then F(θ j ) = m X We = I · 106 , W f = 0, and W∆ f = I · 10−3 . These settings ensure optimal tracking performance since W f = 0, theoretically yielding e j→∞ = 0. In practice, e j→∞ often has a stochastic character due to trial-varying effects such as measurement noise and re-initialization errors at the beginning of the trial. Trial-varying, but deterministic disturbances also affect e j→∞ . The amplification of trial-varying effects is balanced with the convergence speed by setting W∆ f = I · 10−3 . The dominant trial-varying disturbance is an occasional outlier of the image processing algorithm, see Appendix A. The experimental results are presented in the next section, the ILC with basis functions is compared with standard normoptimal ILC (where Ψ = I compared to (10)) in a case study. ξi−1 θ j [i], i=1 with m = 5. The scaling in ξ(z) with the sampling frequency f s is to improve the numerical conditioning, and is related to the δ-operator approach in [13, Section 12.9]. The basis functions Ψ = ∂θ∂ j F(θ j )r resulting from this choice for F(θ j ) are given by: h i Ψ = r, ξr, ξ2 r, ξ3 r, ξ4 r 5.2. Experimental results (10) In this section, the control strategy developed in the previous section is experimentally verified. The objective is to demonstrate accurate tracking for the set of benchmark deformations (see Section 3.3), where the scanner in the carriage is used for the paper displacement measurement. Additionally, the results also include a comparison with standard norm-optimal ILC to support the discussions. In total, 60 trials are performed, where the reference for the MPD (see Fig. 5 and Fig. 9, resp.) is changed from r = r1 to r = r2 and from r = r2 to r = r3 at trials 20 and 40, respectively. The parameter vector θ j , is not re-initialized when changing the reference. Note that for norm-optimal ILC: Ψ = I and W f = I · 10−12 to ensure the existence of the inverses in (9). The initial feed forward θ0 = 0. Since Ψ consists of differentiations of the reference, the parameters θ j can be directly interpreted as the feedforward parameters compensating for effects related to: position, velocity, acceleration, jerk, and snap, see [19]. Remark 3. The selection of the feedforward parameterization F(θ j ) can be viewed as selecting a model structure in a system identification experiment [3]. The reference r can be interpreted as the excitation of the system. The correspondence of F(θ j )−1 and Pz is therefore expected to be related to the power spectrum of r in relation to the unknown disturbances (similar to signal-to-noise ratio in system identification). It is expected that when the frequency spectrum of r does not change significantly during experiments, the tracking error will also remain 8 The experimental results are presented in Fig. 11 and Fig. 12. The tracking performance is defined Je = eTj We e j , and shown in Fig. 11. The results show that both the ILC with basis functions and the standard ILC improve performance compared with feedback only (trial 0). The main result is that the parameterized approach is insensitive to the change in reference at trial 20 and 40, in contrast to the standard ILC, that shows a large decrease in tracking performance (increase in function value of Je ). The results show that the standard ILC is able to achieve better tracking performance than the designed ILC with basis functions, but lacks extrapolation capabilities. This observation is supported by the results presented in Fig. 12, that show the time domain tracking errors for the three references (columns) and the two methods (rows). It shows that both methods have a learning transient when r1 is applied, since θ0 = 0. When the second reference is activated, the norm-optimal ILC shows a large increase in tracking error, in contrast to the ILC with basis functions, where the tracking error does not increase. Very similar behavior is observed when r3 is applied. In conclusion, the presented controller design meets the requirements in the problem formulation, see Section 2.3, for the presented benchmark. The actual print quality is a complex function of the paper positioning error, and many other variables. The peak value of the positioning error should be typically lie inside some band of, e.g., 10 to 20 µm for this particular inkjet process. The presented technique achieves exactly that, consistent tracking within a certain band of error. This is in contrast to standard ILC, where the tracking error increases significantly after a reference change, and reduces again in several iterations. Therefore, the proposed control technique is a proper candidate for the compensation of paper deformations. the printed image and comparing it with the digital image it may be possible to measure the paper displacement. The reference trajectories used in this paper have been designed a priori to serve in a benchmark experiment. To compensate the paper deformation adequately, the deformation has to be measured on-line. The deformation measurement can follow along the same lines as the measurements presented in Fig. 2. By printing invisible markers, and scanning them at a later time instant, the deformation can be determined. The references that compensate the deformation have to be generated from this measurement data, and then applied to the medium positioning drive. The presented ILC algorithm can then be used to achieve good tracking performance for the varying references. 6. Conclusion In this paper, an iterative learning controller with basis functions is presented that aims to compensate paper deformation in wide-format inkjet printers. The paper displacement is measured directly using a scanner inside the print-head carriage. The control algorithm relies on a linear parameterization of the feedforward such that the learning update can be computed analytically from the measured tracking error. The ILC design is verified and compared with standard norm-optimal ILC in an reproducible experimental study, where a set of reference trajectories is introduced that represents severe paper deformation. The experimental results show that the ILC with basis functions achieves good tracking performance for the entire reference set, in contrast to standard ILC, that suffers from significant performance degradation when the reference is changed on-line. Ongoing research is towards performance limitations imposed by the linear parameterization of the feedforward, the optimal selection of basis functions, and two-degree-of-freedom ILC controllers that deal with conflicting performance variables. Remark 4. The results in Fig. 11 and Fig. 12 illustrate that the standard norm-optimal ILC can achieve significantly lower tracking errors than the ILC with basis functions. This is attributed to the fact that standard norm-optimal ILC is able to compensate for all trial-invariant disturbances. The current parameterization of the feedforward is only in terms of r, see Fig. 9, with the number of basis functions m much smaller than the trial length n. Hence, the converged tracking errors may still have repetitive constant due to effects unrelated to r, or, due to a too low number of basis functions m. Nevertheless, the basis Ψ can always be extended from m to n linearly independent basis functions, recovering standard norm-optimal ILC and its performance; while still maintaining extrapolation properties with respect to r. Acknowledgment The authors would like to acknowledge the fruitful discussions with late Okko Bosgra that have significantly contributed to the results presented in this paper, and thank Xueji Zhang and Bas Lemmen who have performed preliminary experimental work. This work is supported by Oc´e Technologies, P.O. Box 101, 5900 MA Venlo, The Netherlands. This work is also supported by the Innovational Research Incentives Scheme under the VENI grant “Precision Motion: Beyond the Nanometer” (no. 13073) awarded by NWO (The Netherlands Organisation for Scientific Research) and STW (Dutch Science Foundation). 5.3. Implementation of deformation compensation in the actual printing process The paper displacement method presented in Section 3.2 relies on visible marker lines that have been printed a priori. During actual printing, the printing of visible marker lines undesired. This issue can be solved by printing invisible markers instead of black lines. Examples include small yellow dots, or markers printed with fluorescent ink. Another option is to use the printed image itself as a marker. In this case, by scanning Appendix A: Image processing algorithm The position of the marker lines is determined from a scan by firstly dividing the scan into small segments along the carriage direction, see Fig. 13 (left) for a single scan-segment. Secondly each segment is averaged in the carriage direction, see Fig. 13 9 i “figExpCostFcn˙temp” — 2013/8/15 — 15:35 — page 1 — #1 i 1 10 0 Je (fj ) · 10 7 10 −1 10 −2 10 0 2 4 6 8 10 12 14 16 18 20 22 24 26 28 30 32 34 36 38 40 42 44 46 48 50 52 54 56 58 60 Trial Figure 11: Performance function values Je (θ j ) = ezj T We ezj : ILC with basis functions () is insensitive to the reference changes r1 → r2 (black dashed) at j = 20 and from r2 → r3 at j = 40 (black dotted), in contrast to standard norm-optimal ILC (4). i i “trackingerrorsExp˙temp” — 2013/8/29 — 16:10 — page 1 — #1 Trials 20 − 29, r2 Trials 0 − 19, r1 −5 6 x 10 Trials 40 − 59, r3 Basis functions ezj [m] 4 2 0 −2 −4 −6 −5 6 x 10 Norm optimal ezj [m] 4 2 0 −2 −4 −6 0.05 0.1 0.15 0.2 0.25 Time [s] 0.3 0.35 0.05 0.1 0.15 0.2 0.25 Time [s] 0.3 0.35 0.05 0.1 i 0.15 i 0.2 0.25 0.3 0.35 Time [s] Figure 12: Time-domain tracking errors: r1 (left column), r2 (middle column), r3 (right column), ILC with basis functions (top row), norm-optimal ILC (bottom row). The ILC with basis functions achieves accurate tracking within the indicated error bounds (black dotted), in contrast to standard ILC. 10 i i i i i i “plantOLexp˙temp” — 2013/8/15 — 15:35 — page 1 — #1 “marker˙temp” — 2013/8/15 — 15:35 — page 1 — #1 Paper transport direction → [m] Magnitude [dB] 10 −10 −20 −30 −40 180 90 50.061 50.12 Time [ms] 50.18 50.240 0.5 Phase [◦ ] 50 0 1 Average [-] 0 −90 Figure 13: Segment of a scan (left) and the column-average (right). −180 0 10 2 10 Frequency [Hz] (right) for an averaged segment. Thirdly, the marker position in the segment is determined by performing a threshold and lineintersection operation on the averaged segment. In essence, each segment provides a sample of the paper position as function of the carriage position. The paper position as function of the time is calculated using a coordinate transformation from the carriage position to time, the latter involves linear interpolation and zero-phase low-pass filtering. The segment width is chosen carefully: the narrower the segment the more position measurement samples are obtained from a scan, this is at the expense of increased variance introduced by measurement noise. The wider the segment width the more averaging of noise, at the expense of less samples and hence less time-resolution. Figure 14: Bode diagrams of the: open loop CPfrf (solid black), scaled controller 5 · 10−6 C (dashed red), sensitivity S frf (dashed-dotted blue). [5] Bolder, J., Oomen, T., Steinbuch, M., 2013. Exploiting Rational Basis Functions in Iterative Learning Control. In Proc. Conference on Decision and Control, Florence, Italy, 7321–7326. [6] Bristow, D., Alleyne, A., 2008. Monotonic Convergence of Iterative Learning Control for Uncertain Systems Using a Time-Varying Filter. IEEE Transactions on Automatic Control 53, 582–585. [7] Bristow, D., Tharayil, M., Alleyne, A., 2006. A survey of iterative learning control: a learning-based method for high-performance tracking control. IEEE Control Systems Magazine 26, 96–114. [8] Butcher, M., Karimi, A., 2010. Linear Parameter-Varying Iterative Learning Control With Application to a Linear Motor System. IEEE/ASME Transactions on Mechatronics 15, 412–420. [9] Chen, Y., Moore, K. L., Yu, J., Zhang, T., 2008. Iterative Learning Control and Repetitive Control in Hard Disk Drive Industry - A Tutorial. International Journal of Adaptive Control and Signal Processing 23, 325–343. [10] Chu, B., Owens, D., 2013. Singular Value Distribution of Non-Minimum Phase Systems with Application to Iterative Learning Control. In Proc. Conference on Decision and Control, Florence Italy, 6700–6705. [11] Devasia, S., 2002. Should Model-Based Inverse Inputs Be Used as Feedforward Under Plant Unvertainty? IEEE Transactions on Automatic control 47, 1865–1871. [12] Freeman, C., Alsubaie, M. A., Cai, Z., Rogers, E., Lewin, P., 2011. Initial Input Selection for Iterative Learning Control. Journal of Dynamic Systems, Measurement, and Control 133, 6. [13] Goodwin, G., Graebe, S., Salgado, M., 2000.iControl System Design. Prentice Hall. [14] Gunnarsson, S., Norrl¨of, M., 2001. On the design of ILC algorithms using i optimization. Automatica 37, 2011–2016. [15] Harriman, D., 2005. Control Systems Challenges in the HP Personal Ink Jet Printing Application. Proceedings of the American Control Conference, Portland, OR, USA, 1138–1141. [16] Hoelzle, D., Alleyne, A., Johnson, A. W., 2011. Basis Task Approach to Iterative Learning Control With Applications to Micro-Robotic Deposition. IEEE Transactions on Control Systems Technology 19, 1138–1148. [17] Janssens, P., Pipeleers, G., Swevers, J., 2012. Initialization of ILC based on a previously learned trajectory. In Proc. American Control Conference, Montr´eal, Canada, 610–614. [18] Janssens, P., Pipeleers, G., Swevers, J., 2013. A Data-Driven Constrained Norm-Optimal Iterative Learning Control Framework for LTI Systems. IEEE Transactions on Control Systems Technology 21, 546–551. Appendix B: Bode diagrams feedback filters The frequency responses of the open-loop CPfrf , the controller C and the sensitivity measurement S frf are shown in the Bode diagram in Fig. 14. The feedback controller C is a lead filter. The bandwidth (lowest frequency where |CPy (eiω )| = 1) of the feedback control system is approximately 11.4 Hz and the modulus margin max |S (eiω )| = 2.7 dB [31]. References 1 10 i [1] Amann, N., Owens, D., Rogers, E., 1996. Iterative learning control using optimal feedback and feedforward actions. International i Journal of Control 65, 277–293. [2] Barton, K., Hoelzle, D., Alleyne, A., Johnson, A., 2011. Cross-Coupled Iterative Learning Control of Systems with Dissimilar Dynamics: Design and Implementation for Manufacturing Applications. International Journal of Control 84, 1223–1233. [3] Boeren, F., Oomen, T., 2013. Iterative Feedforward Control: A Closedloop Identification Problem and a Solution. In Proc. Conference on Decision and Control, Florence, Italy, 6694–6699. [4] Bolder, J., Lemmen, B., Koekebakker, S., Oomen, T., Bosgra, O., Steinbuch, M., 2012. Iterative learning control with basis functions for media positioning in scanning inkjet printers. In Proc. Multi-Conference on Systems and Control, Dubrovnik, Croatia, 1255–1260. 11 [19] Lambrechts, P., Boerlage, M., Steinbuch, M., 2005. Trajectory planning and feedforward design for electromechanical motion systems. Control Engineering Practice 13, 145–157. [20] Lee, J., Lee, K., Kim, W., 2000. Model-based iterative learning control with a quadratic criterion for time-varying linear systems. Automatica 36, 641–657. [21] Mishra, S., Coaplen, J., Tomizuka, M., 2007. Precision Positioning of Wafer Scanners Segmented Iterative Learning Control for Nonrepetitive Disturbances. IEEE Control Systems Magazine 27, 20–25. [22] Mishra, S., Tomizuka, M., 2009. Projection-Based Iterative Learning Control for Wafer Scanner Systems. IEEE/ASME Transactions on Mechatronics 14, 388–393. [23] Moore, K. L., 1993. Iterative Learning Control for Deterministic Systems. Springer-Verlag. [24] Oomen, T., Bosgra, O., van de Wal, M., 2009. Identification for robust inferential control. In Proc. Joint Conference on Decision and Control and Chinese Control Conference, Shanghai, China, 2581–2586. [25] Oomen, T., van de Wijdeven, J., Bosgra, O., 2011. System Identification and Low-Order Optimal Control of Intersample Behavior in ILC. IEEE Transactions on Automatic Control, 2734–2739. [26] Pintelon, R., Schoukens, J., 2012. System Identification, a Frequency Domain Approach. 2nd Edition, Wiley. [27] Pipeleers, G., Moore, K. L., 2012. Reduced-Order Iterative Learning Control and a Design Strategy for Optimal Performance Tradeoffs. IEEE Transactions on Automatic Control 57, 2390–2395. [28] Pond, S., 2000. Inkjet Technology and Product Development Strategies. Torrey Pines Research. [29] Rotariu, I., Steinbuch, M., Ellenbroek, R., 2008. Adaptive Iterative Learning Control for High Precision Motion Systems. IEEE Transactions on Control Systems Technology 16, 1075–1082. [30] Sanathanan, C., Koerner, J., 1963. Transfer function synthesis as a ratio of two complex polynomials. IEEE Transactions on Automatic Control, 56–58. [31] Skogestad, S., Postlethwaite, I., 2005. Multivariable Feedback Control: Analysis and Design. Wiley. [32] van de Wijdeven, J., Bosgra, O., 2010. Using basis functions in iterative learning control: analysis and design theory. International Journal of Control, 661–675. [33] van der Meulen, S., Tousain, R., Bosgra, O., 2008. Fixed structure feedforward controller design exploiting iterative trials: application to a wafer stage and a desktop printer. Journal of Dynamic Systems, Measurement and Control: Transactions of the ASME 130, 1–16. [34] Zapata, P., Fransen, M., ten Thije Boonkkamp, J., Saes, L., 2012. Heat and moisture transport in a paper sheet moving over a hot print surface. IEEE Communications Letters, 17. 12
© Copyright 2026 ExpyDoc