Annals of Clinical Biochemistry, 1978, 15, 77-85
An evaluation of the Hyland laser nephelometer
PDQ system for the measurement of
immunoglobulins
J. T. WHICHER, D. E. PERRY, AND J. R. HOBBS
From the Specific Protein Reference Unit, Department of Chemical Pathology, The Westminster Hospital,
London
The Hyland laser nephelometer PDQ system for the assay of specific proteins is described.
The results of evaluating the system to measure immunoglobulins IgA, IgG, and IgM are summarised. Within-batch and between-batch precision, accuracy, reliability, and safety are discussed.
This instrument represents an important development in the immunochemical assay of proteins
in clinical medicine. The speed, precision, and convenience of this new generation of discrete
nephelometric analysers make such systems attractive to the clinical chemist.
SUMMARY
The immunochemical measurement of proteins,
first described in the 19205, has now become an indispensable tool in clinical chemistry. Quantitation of
proteins based on the light scattering properties
of specific immune complexes was first described
in the late 19305 (Libby, 1938). Since then many
studies have been performed culminating in the
development of the continuous-flow nephelometric
system (Kahan and Sundblat, 1967).
A new generation of instruments is now appearing
on the market incorporating a laser as a radiation
source and measuring forward light scatter. Such
instruments are manual or automated discrete
analysers with a high degree of sensitivity and a
wide measurement range (Caputo, 1976; Deaton
et al., 1976). Similar nephelometric systems have
been incorporated into centrifugal analysers (Buffone
et al., 1975).
The purpose of this work was to evaluate the
Hyland laser nephelometer PDQ system under
routine laboratory conditions. The evaluation
was carried out along the lines suggested by the
IFCC Committee on Standards (Buttner et al., 1976).
and IgG may also be measured in cerebrospinal
fluid samples.
The system comprises a discrete digital readout
laser nephelometer with accessory equipment,
such as dilutors and the necessary reagents. The
technique is based on the production of immune
complexes by the reaction of antigen and monospecific antibody in the presence of polyethylene
glycol which enhances immune complex formation
(Lizana and HeUsing, 1974). The resultant complexes
scatter an incident beam of light, the amount of
light scattered being proportional to the concentration
of antigen.
THE LASER NEPHELOMETER
The nephelometer consists of a control and display
section which houses the instrument electronics
with the laser radiation source and an optics
section containing the cuvette compartment and
photomultiplier tube (PMT).
Sample handling is discrete, each cuvette being
placed in the light path by hand. The cuvettes
are disposable glass test-tubes with no special optical
properties.
The radiation source is a low powered (0'5 mW)
helium neon gas laser tube, producing a highly
collimated beam of radiation 0·9 mm in diameter
at 632·8 om. The light beam strikes the cuvette at
90°, the resultant light scatter is detected at a
forward scattering angle of 31 ° by a photomultiplier
tube (spectral response type 4), the coUection
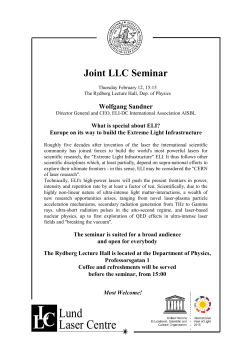
angle is set by two fixed slits (Fig. 1). The forward
scatter angle makes use of the Mei scatter produced
Description of the Hyland PDQ system
The Hyland laser nephelometer PDQ system
contains all that is required to measure a number
of specific proteins. The range at present includes
serum IgG, IgA, IgM, C3, C4, albumin, alpha-lantitrypsin, haptoglobin, and transferrin; albumin
Correspondence should be addressed to I. T. Whicher
77
Downloaded from acb.sagepub.com by guest on January 20, 2015
78
J. T. Whicher, D. E. Perry, and J. R. Hobbs
fixpdslits
\0
'\
r
- -----00
radialion
trap
cUW'tte
Fig. 1 Diagram of optics section of the instrument
showing the detection offorward light scatter by the
photomultiplier tube PMT.
by large molecules; the angle chosen is said to
minimise error caused by the scattering produced
by stress defects and minor scratches on the cuvettes.
The scattered radiation is collected over a variable
(operator controlled) 'compute' period (between
5 and 90 seconds). During this period, a pulse height
analyser detects and rejects spurious large amplitude
scattering pulses from falling dust particles. The
final relative light scatter (RLS) is displayed on a
4-digit digital display to one decimal place.
Mode of operation of the analyses
1. The samples and standards are diluted into
filtered blank diluent (0'15 mol/I sodium chloride)
and antiserum in the cuvettes. After suitable
incubation, the light scattering is read on the
nephelometer. The incubation period must be
greater than one hour, the tests are stable for four
hours.
2. After the initial instrument warm-up period, the
nephelometer is electrically cancelled.
3. The RLS of the blank diluent is measured
(buffer blank) and the instrument is reset to zero.
4. The sensitivity of the instrument is set using the
highest standard concentration in use. The sensitivity
range is wide.
5. The RLS of the antibody solution is measured
(antibody blank); this is held electronically by the
nephelometer.
6. The test blank is read, the RLS is held electronically by the nephelometer memory.
7. The test is read, the final RLS value displayed in
this mode is the actual test RLS corrected for both
the antibody blank RLS and the individual test
blank RLS.
Two readings are therefore required for each
test; usually the compute time used is 15 seconds.
ACCESORY EQUIPMENT
Two dilution systems are supplied, their use depen-
ding on the final dilution required for the assay.
Dilutions of 1:1000 or less are made directly into
the antibody or blank solution. One millilitre of the
reagent is delivered directly into the cuvettes using
the SMI micropettor (Alpha Laboratories, Greenford, Middlesex), 1-5 Jkl of sample is then placed in
the cuvette using the positive displacement type
SMI micropettor. Dilutions of greater than 1:1000
are made using a preliminary dilution in 0'15 mol/l
sodium chloride; this is made with an Oxford
pipette (Boehringer i Sussex) and a dispensette
(Brand, Wertheim, Germany), followed by a dilution
into the reagent or blank solution using an Oxford
and 8MI micropettor.
Nucleopore filters (0'4 Jkm) and filter holders
are supplied for filtering the reagents (Nucleopore
Corp., California, USA).
Four invertible cuvette racks, each holding 48
cuvettes are supplied.
REAGENTS
Each specific protein reagent package contains the
following:
1. Sixty-five millilitres of prediluted, specific goat
antiserum. This is diluted with an equal volume of
'buffer'-a sodium chloride solution containing
polyethylene glycol and a wetting agent.
2. Six reference sera calibrated in mg/dl (Hyland)
mg/dl (WHO) and iu/rnl (WHO). The ranges are
shown in Table 1.
3. A pack of disposable cuvettes.
Reagents are sufficient for 120 assays.
Table 1 Approximate range covered by reference sera
Parameter
Unit
IgA
mg/dl (Hyland)
m,l/dl(WHO)
iu/ml(WHO)
25- 50
15- 490
11- 360
IgG
mg/dl (Hyland)
mild] (WHO)
iu/ml (WHO)
100-2500
100-2300
12·280
IgM
mg/dl (Hyland)
mg/dl(WHO)
iu/ml(WHO)
10- 250
10- 250
12- 300
Rang~
A regression of RLS against antigen concentration
produces a slightly sigmoidal curve. The results
may be calculated manually from this or by using
an on-line Hewlett Packard 9815 calculator interfaced to the nephelometer. The HP 9815 allows
automatic data acquisition and calculates the results
using a third order polynomial curve fitting procedure. (The programme is supplied by Hyland).
Downloaded from acb.sagepub.com by guest on January 20, 2015
An evaluation of the Hyland laser nephelometer PDQ system for the measurement of immunoglobulins
Materials and methods
IgG AND IgA ASSAY. AUTOMATED
IMMUNOPRECIPITATION (AlP)
The AlP system used was constructed from standard
Technicon modules, the flow diagram is shown in
Fig. 2. The entire manifold was washed through
with sodium hypochlorite followed by sodium
hydroxide before and after each run (Hall, 1973).
Serum samples were diluted 1:100 with 0'15 mol/I
sodium chloride containing 0·5 mill Tween 20
(Koch Light Ltd) using a MicroMedic dilutor.
SAMPLER
1/1
lOO/h
ml/min
• 0'8
from FC
• air
0:32
antiserum
1{)
scrr(lier
wash
•
•
waste
0·1
"0
scrrole
•
saline. Tween
FC to PJmp
FUJORONEPHELOMETER
355 nm
Fig. 2 Manifold diagram for AlP system.
The antisera
IgG assay: sheep antihuman IgG FC (Department
of Experimental Pathology, Birmingham University),
diluted 1:70. 19A assay: goat antihuman 19A
(Atlantic Antibodies, Maine, USA), diluted 1 :40.
The antisera were diluted in a solution containing
polyethylene glycol 6000 (BDH, London), 40 gil,
made up in the sodium chloride solution with Tween.
The diluted antisera were allowed to stand for 30
minutes at room temperature before being filtered
through a 0'22 p.m Millipore membrane filter.
Blank assays were performed by substituting the
antiserum diluent for the antiserum. The sampling
rate was 100 an hour with a sample wash ratio of 1:1.
Standard curves (PDQ standards) were run every
40 samples, a pooled serum QC was run every 10
samples. Blanks were performed on the entire test
series. With the exception of the low dilutions of the
WHO (World Health Organisation) 67/99 preparation, these were never more than 10 to 15 % of the
test peak height. Peak heights were measured in
79
millimetres and the blank peak heights subtracted
from the test peaks. The standard curves were
plotted manually to check the curve profile; the
results were calculated usinga third order polynomial
curve fitting procedure, programmed into a Hewlett
Packard 9815 calculator.
IgM ASSAY RADIAL IMMUNODIFFUSION (RID)
RID was chosen as the comparator method for
the IgM assay because of the unsuitability of AlP
owing to the high blanks obtained with the WHO
67/99 preparation at the dilution used for the AlP
IgM assay.
The method used was a modification of that
described by Mancini (Hobbs, 1970). The RID
plates were prepared in our laboratory as follows:
Glass plates (10 em x 15 em) were placed on a
level surface. The agarose solution containing the
antibody was carefully poured on to the methanolcleaned surface of the plate. The agarose was a
10 gil solution of Litex HSA agarose (International
Enzymes, Windsor) made up in 0·06 mol/I barbitone
buffer pH 8·6. Antihuman IgM (Dakopatts AIS,
Copenhagen) was used at a final concentration
of 3'3%. The prepared plates were kept at 4°C for
at least two hours before use. When used, the plates
were allowed to stand at room temperature for 15
minutes to enable the surface moisture to evaporate.
Wells 1'5 mm in diameter were cut using a bevelled
edge stainless steel cutter and suction. The 3 p.l
sample volumes were placed in the wells using a
Hamilton syringe as soon as possible after the wells
had been cut.
When all of the wells had been filled the plates
were incubated at 37°C for 16 hours in a sealed wet
box. After incubation the plates were squashed,
dried, and stained with Coomassie blue. The
precipitin ring diameters were measured to the
nearest 0·1 rom in two axes using a magnifying
eyepiece (Matchless Machines Ltd).
Sera and standards were assayed undiluted. The
PDQ standards and the pooled QC material were
distributed over the plate to give indications of
non-uniformity of the gel thickness. The regression
of log diameter against antigen concentration
gave a slightly curved line, being more non-linear
at the highest antigen concentrations.
Practicability
SPEED
Two variables are important: the rate at which
samples can be processed and the interval between
presentation of the sample and the availability of the
result.
Downloaded from acb.sagepub.com by guest on January 20, 2015
J. T. Whicher, D. E. Perry, and J. R. Hobbs
80
1. A batch of some 70 samples can be analysed in
four hours for the measurement of one parameter.
This time comprises approximately 90 minutes for
manual sample dilution, one hour for incubation,
and 90 minutes for measuring the results and
calculations.
2. The time needed to analyse one specimen from
the moment of the arrival of the sample in the
laboratory to the availability of the result varies
between 30 (JgG) and 90 minutes (JgM). The
important point when compared with some other
immunological techniques is that the results are
available on the same day.
is easy to set up and remains stable for at least eight
hours without the need for reealibration.
Precision
(Table 2)
Within-batch precision was assessed by performing
duplicate analyses of patients' samples. This has
the advantage of evaluating more of the factors
WITHIN-BATCH PRECISION
Table 2 Within-batch precision, assessed by 50 duplicate
assays ofpatients' samples
Parameter
Mean iulml
Standard
deviatto«
Coefficknt 0/
'aritltion ("'l
lIlA
IIIG
111M
140
123
144
"6
3'9
6'7
4
3·2
4·7
COST
Although the capital cost of the nephelometer is
high (£5000), it is probable that the cost per test as
far as reagents are concerned will be lower than
that of currently available commercial Mancini
plates. The instrument is able to perform small
numbers of tests-for example, 'one off' estimations
-with little wastage of reagents.
TECHNICAL SKILL REQUIREMENTS
The ability to handle automatic pipettes or automatic
diluting systems are the only technical requirements
needed. The use oftheoptionalon-linedeskcalculator
lessens imprecision caused by manual curve fitting.
DEPENDABILITY
The instrument is robust, although the alignment
of the optical system should be checked after
transit. During 10 months of use there was one
failure of a component in a printed circuit. No
problems were encountered with the laser or the
photomultiplier tube.
contributing to imprecision than does replicate
analysis of control material. The effects of imprecision at the extremes of the measurement range
and potentially interfering factors such as lipaemia
and paraproteinaemia are taken into account.
(Table 3)
Between-batch precision was assessed by using three
materials:
1. The WHO immunoglobulin preparation 67/99.
This is a freeze-dried material which is distributed
in sealed ampoules. Once reconstituted, this was
stored in sealed containers at 4°C in the presence of
0·01 mol/l sodium azide.
2. The IFCC putative immunoglobulin standard
IFCC 74/1. This is a frozen serum preparation. A
new ampoule was used for each batch.
BETWEEN-BATCH PRECISION
SAFETY
1. The nephelometer is powered by a 220 volt
supply derived from a stabilised transformer.
The output connection from the transformer is not a
UK standard connector. The main connections and
the 220 volt connections were examined for earthing
characteristics and found to be satisfactory. The
transformer generates heat and it is therefore
important to ensure that there is adequate
ventilation.
2. The handling of reaction mixtures in individual
cuvettes presents a significant advantage over gel
techniques in terms of processing infected material
such as hepatitis-positive samples.
GENERAL COMMENTS
The information provided with the instrument and
reagents by the manufacturer is more than adequate
and contains some background data. The instrument
Table 3 Between-batch precision, assessed on 20
separate batches
Parameter Control
material
Mean
iulml
Standard
deviation
Coefficient 0/
varia/Ion ("'l
lIlA
WHO 67/99
IFCC 74/1
Behrinll
standard
serum
10"6
108
12·6
10'8
157
15'5
12
10
9'9
liG
WHO 67/99
IFCC 74/1
Behrinll
standard
serum
93-6
105'6
140'7
5·6
7'0
9,'
6·0
6'6
6'8
IgM
WHO 67/99
IFCC 74/1
Behrinll
standard
scrum
99'6
146
130
8'0
10'0
9·4
8'0
6'8
7·2
Downloaded from acb.sagepub.com by guest on January 20, 2015
A~ evaluation of the Hyland laser nephelometer PDQ system for the measurement of immunoglobulins
3. A commercially available standard serum (Behring Standard Human Serum Batch No. B 975).
Analysis of method variance
INSTRUMENT VARIANCE
This comprises the sum of the error of measuring
the light scattering of the test and the blank. Both
measurements are influenced by the computing time
and sensitivity setting. The influence of computing
time is shown in Table 4.
Table 4 The influence of computing time on precision
ofreading the test RLS of a single tube (sensitivity
setting 2)
Computinl time (seconds)
Mean RLS
Standard deviation
Coefficient of variation (X)
IS
172-9
1'7
1'0
S
170'8
1'1
0'6
30
173'6
4'3
2·S
81
assays both require a final sample dilution of 1 :4000"
IgM requires a final sample dilution of 1 :1000.
Dilutions of 1:1000 or less were made using a
SMI micropettor, the sample being diluted directly
into the antibody or blank solution. Dilutions
greater than 1 :1000 were made using two dilutions.
The first in 0·15 mol/l sodium chloride solution and
the second into antibody or blank solution. Thus for
the IgG and 19A assays an initial 1:100 dilution was
made using an Oxford pipette (50 ILl) and a dispensette (5 ml). A subsequent dilution of 1 :41 was made
using an Oxford pipette (25 ILl) and an SMI micropettor (l ml), see Table 5.
The precision of the two diluting systems was
assessed using a solution of 1251 in serum.
Table 5 Precision ofpipetting steps
Mode of J : 100 dilution
Mean coum«
per minute
Standard
deviation
Coefficlen' of
.0rlotI01l (Xl
SMI micropettor I III
+ SMI micropettor I ml
88478
1402
I·S8
Oxford sampler SO III
Dispensette S ml
Oxford 100 III
SMI micropettor I ml
S2ll6O
2091
4·0
2'0
5Pr6itivity 5!'tti1gs
I·e
······· .. 2
------ 3
16
--~
1'~
2.
1-2
;
'·0
Ac:c:uracy
u 0'8
0·6
O·~
n
O+-~-~--~-~-~~~~~-
o
2O~060
8J
100
120
1~0
__-:-:-
EO
8l
RLS
Fig. 3 The effect of sensitivity setting on the precision
of reading the RLS of the reference sera (1-6).
In the absence of a definitive method for immunoglobulin measurement, accuracy was assessed (a)
by comparing the results with those obtained using
conventional methods, (b) measuring the reference
materials, (c) testing for parallelism between various
test materials, (d) assessing the reference range.
COMPARISON WITH OTHER METHODS, USING
The influence of sensitivity setting is shown in
Fig. 3. It is clear from the results shown in Fig. 3
that the precision of measurement is best at high RLS
values and is largely independent of the actual light
scattering properties of the solution and the
instrument sensitivity setting. It is thus desirable
to measure the light scatter at the highest possible
sensitivity setting, thereby obtaining the maximum
RLS values. For example, a sample giving a reading
of 3·1 RLS with a coefficient of variation (CV) of
4·7 % at sensitivity setting 3 gave a RLS of 23·7
with a CV of 2'36% at sensitivity setting 5.
DILUTION ERROR
Two dilution systems are available from the manufacturers for making manual sample dilutions.
The choice between them depends on the final
dilution required for the assay. The IgG and 19A
SAMPLES FROM PATIENTS
The methods used for comparison were radial
immunodiffusion for IgM and automated immunoprecipitation for IgG and 19A. The results are
shown in Table 6 and Figs 4, 5, and 6. The samples
from patients came from a wide range of different
disease states. Paraproteins were excluded as we do
not quantitate them immunochemically.
Discrepancies between immunochemical methods
Table 6
samples
Comparison of results on 150 patients'
Parameter
lnl.rcepl (iulml)
IIA
IIG
11 M
(IS)
10·6
0
Downloaded from acb.sagepub.com by guest on January 20, 2015
Slope
(0'76)
0·99
0'98
Correlation
COt!fficlen'
0'92
0·89
0'91
J. T. Whicher, D. E. Perry, and J. R. Hobbs
82
4SO
3'.iO
400
300
3SO
250
300
-:.
~250
E
~ 200
~ 150
«
.'
100
.-:
50
../::...::: :
.:
o
'
.
.
Cl
lSO
0:
100
: .
so
r..
,.'
..
50
iu/ml
Laser
100
150
200
o¥--~-~~-~-..-----,--~--r-.,.-o SO 100 150 200 25O:IX) ~ 400 4SO
250
Loser (ju/ml)
Fig.4 IgA: comparison of AlP and laser nephelometer.
Fig.6 IgM: comparison of RID and laser nephelometer.
180
300
....--/-_.-.--.
0 -
/
160
120
.2
0-
/
100
« 100
~:
.. '.,.
\I)
...J
80
-:
/0
°
140
200
0---.-----
/
./
_0 _0
.
•
19A
• IgM
• IgG
0:
Oh-."""""""""""--"--"""""""""""""""""""""""""""T""T"T""TT""T""-rT"
o
100
200
300
60
Laser iu/ml
Fig. 5 IgG: comparison of AlP and laser nephelometer.
40
°
I
20
may be method dependent or antiserum dependent.
Both factors are known to influence the measurement
of C3 (Alper and Rosen, 1975) and haptoglobin
(Laurell, 1972), but have not yet been fully studied
for the measurement of immunoglobulins (Grubb,
1973). It was not possible to evaluate the relative
contributions of the two factors.
°
0
a
~
40
60
80
100 .120
(min)
Fig. 7 The effect of incubation time on the development
ofRLS.
Downloaded from acb.sagepub.com by guest on January 20, 2015
An evaluation of the Hyland laser nephelometer PDQ system for the measurement of immunoglobulins
The method comparison data for the IgA are not
well described by a linear regression and are best
described by a curve (Fig. 4). This is probably
owing to the fact that the high IgA samples had not
reached completion of reaction during the incubation
time of one hour (Fig. 7) and are consequently
producing lower results at antigen concentrations
above 150 iu/rnl, The slope of the regression for
samples above this value is 1·4. A regression of the
samples with values below 150 iu/rnl has a slope of
1·0. The data given in Table 6 are thus of little use
for IgA.
The IgG and IgM results show a good correlation
between laser nephelometry and RID.
MEASUREMENT OF REFERENCE MATERIALS
The reference materials were assayed in 10 separate
batches. The mean values achieved using the Hyland
PDQ standards are shown in Table 7. The values
obtained for IgA are all significantly greater (by
Student's t test, P > 0'001) than the ascribed
values. The mean values obtained for IgG are
lower and those for IgM are inconsistent.
Table 7 Assay of other reference material
Parameter Reference
material
IgA
WHO 67{99
IFCC 74/1
Behring
standard
serum
Value
obtained
(iulml)
Percentage
deviation
149
105'6
108
157
+9'7
+1'8
+5·3
Ascribed
value
(iulml)
96'2
106
IIG
WHO 67/99
IFCC 74/1
Behring
standard
serum
96'2
107
148
93'6
105·6
140'7
-2'7
-1'3
-5-1
11M
WHO 67/99
IFCC 74/1
Behring
standard
serum
96'2
145
133
99·6
146
130
+3'5
+0'7
-2'3
83
180
160
140
120
100
• PDQ Standards
'"
..J 60
- WHO 67/99
• IgA ParaproI,,;n
"'60
40
20
,.1,-
a .,.0a
200
300
400
iu/ml
The IgA content of the paraprotein containing serum was
calculated from the lowest dilution shown.
Fig. 8 IgA assay: laser nephelometer readings obtained
for the Hyland PDQ reference sera (PDQ standards)
and serial dilutions of WHO 67/99 and an IgA
paraprotein containing serum.
kindly provided by Dr Kirrane of the Mater
Hospital, Dublin. These were obtained from 182
normal healthy blood donors in the age range
18 to 65 years (Table 8). The normal range was
derived using a log gaussian distribution. The
validity of the assumption was tested using the
Kolmogorov-Smirnov test (Massey, 1951), there
being no significant deviation at the 5 % level.
A non-parametric method gave comparable results
(Reed et al., 1971). These normal ranges are similar
to those obtained by radial immunodiffusion
(Maddison and Reimer, 1976).
Normal range for IgA, IgG, and IgM using the
Hyland laser nephelometer PDQ system
Table 8
Parameter
Unit
IgA
gil
iu/ml
gil
iu/ml
gil
iu/ml
IgG
TESTS FOR PARALLELISM BETWEEN VARIOUS
TEST MATERIALS
The Hyland PDQ standards, WHO 67/99, and a
number of sera containing paraproteins all gave
parallel dilution curves for the three immunoglobulins. An example of the curves obtained
for IgA is shown in Fig. 8. It is interesting that the
paraproteins show similar behaviour, in this
system, to sera with polyclonal immunoglobulins.
NORMAL RANGE
The normal range data for IgG, IgM, and 19A
derived using the Hyland laser nephelometer were
IgM
95 % confidence interval
0'85-3'35
62'5-246
6-51-15'0
8Q.-185
0'65-3,\3
73'5-381
FACTORS AFFECTING ACCURACY
Antibody specificity is clearly important in any
immunochemical method. The Hyland antisera
were found to be monospecific when tested by
crossed immunoelectrophoresis.
All nephelometric techniques for protein measurement suffer from the potential problem of immune
complex solubility at extreme antigen excess.
This may result in high antigen concentrations giving
Downloaded from acb.sagepub.com by guest on January 20, 2015
84
J. T. Whicher, D. E. Perry, and J. R. Hobbs
a falsely low result. In immunoglobulin assays
this applies particularly to unsuspected paraproteins
giving apparently normal or low results. We found
no problems with polyclonal hypergarnrnaglobulinaemias with levels up to three times that of the
highest reference. We did observe the problem with
one IgG paraprotein which gave a level of 1304 iu/rnl
(104·8 gil) when assayed at a 1:5 dilution but gave a
value of 254 iu/rnl when assayed directly. This
problem is thoroughly discussed in the information
sheet provided by Hyland (Technical Discussion
Document No. 32) and by Deaton et al. (1976).
The diluent used for the blank determinations in
this evaluation was 0'15 mol/l sodium chloride.
It is apparent, however, that there is a substantial
difference between the blank values obtained using
the sodium chloride diluent and those obtained using
a solution containing polyethylene glycol at the
same concentration as is present in the test reagent
(Table 9). This difference is much more pronounced
for some samples than others and does not relate
to the presence of obvious turbidity. We feel that
the use of a polyethylene glycol containing blank
diluent is essential; this will be available in future
reagent packages from Hyland.
High concentrations of antigen take longer to
reach maximum RLS than low concentrations. In
the case of IgG and IgM all the reference sera had
reached plateau values by the end of the one-hour
incubation period. This is not the case for 19A, it is
thus important that an adequate incubation period of
more than two hours is used for this assay. It is
probable that this problem could be overcome by
using a higher affinity antibody.
Sensitivity
The sensitivity of the system is limited only by the
high blank values obtained at low sample dilutions.
For serum immunoglobulins the range of measurement is very wide at the recommended sample
dilution on a single instrument sensitivity setting.
Table 9 Blank values achieved using 0·15 moll I
sodium chloride and polyethylene glycol containing
diluent (1 :1000 sample dilution)
Sample
1
2
3
4
5
6
7
8
9
10
0'/5 molll sodium chloride
9
6'7
10'8
29·1
166'7
9'3
4·4
3·6
5'9
2·2
Polyethylene glycol
14'4
10'3
13'6
46'5
189'3
29
9'6
6'7
7·0
35
Precision is improved, however, by assaying low
concentrations at a higher sensitivity setting than is
used for normal assays (see Fig. 3). IgG may be
measured in both urine and cerebrospinal fluid by
employing a lower sample dilution (1 :400); this is
possible owing to the low blank values obtained
with these fluids. We successfully measured IgA
in saliva using a 1:400 sample dilution. The lower
limit of the reference range under these circumstances
is 0·015 gil with the expected normal range for saliva
being 0'03-0'2 gil. Sensitivity is thus more than
adequate for measuring low levels of immunoglobulins in fluids other than serum.
Subjective assessment
The instrument is quick, reliable, and easy to use.
Very little training was required to operate the
system competently. Regular 'same day' reporting
of results was achieved, in line with other biochemical
measurements performed within the laboratory.
The wide reference range and high sensitivity eliminates the need for special 'low level' assay systems.
The use of the on-line Hewlett Packard 9815
calculator removed much of the tedium associated
with reading and calculating the results.
The dilution systems supplied with the instrument
were somewhat slow and tedious in use and we now
make all dilutions using a fully automatic MicroMedic dilutor. The use of a five-second rather than
a 15-second computing time improved the precision
and increased the speed of the analysis. The sample
size required is small, 1-5 fIoI, making the instrument
suitable for paediatric work. It is expected that
a fully automated sample handling system will be
available soon to run in conjunction with the
present nephelometer using a flow-through cuvette:
this will almost double the price of the system but will
make a substantial improvement in the practicability
of the instrument for handling large workloads.
We should like to thank the Hyland Division of
Travenol Laboratories Inc. for supplying reagent
kits, Mr J. Hunt for arranging the computer processing of the data, and Dr J. A. Kirrane and
Dr M. Buggy for the normal range data.
References
Alper, C. A., and Rosen, F. S. (1975). Clinical application
of complement assays. Advances in Internal Medicine,
20, 61-88.
Buffone, G. J., Savory, J., and Hermans, J. (1975). Evaluation
of kinetic light scattering as an approach to the measurement of specific proteins with the centrifugal analyser. II.
Theoretical considerations. Clinical Chemistry, 21,
1735-1746.
Downloaded from acb.sagepub.com by guest on January 20, 2015
An evaluation of the Hyland laser nephelometer PDQ system for the measurement of immunoglobuhns
Buttner, J., Borth, R., Bostwell, J. H., Broughton, P. M. G.,
and Bowyer, R. C. (1976). International Federation
of Clinical Chemistry Committee on Standards: Provisional
recommendation on quality control in clinical chemistry.
Assessment of analytical methods for routine use. Clinica
chimica acta, 69, FI-FI7.
Caputo, M. J. (1976). In Clinical Evaluation of Serum
Protein Quantitation by a New Laser Nephelometer.
Protides of Biological Fluids. 24th Colloquium, pp. 677-685.
Edited by H. Peeters. Pergamon Press: Oxford.
Deaton, C. D., Maxwell, K. W., Smith, R. S., and Creveling,
R. L. (1976). Use of laser nephelometry in the measurements of serum proteins. Clinical Chemistry, 22,1465-1471.
Grubb, A. (1973). Immunochemical quantitation of IgG:
influences of the antiserum and antigenic population.
Scandinavian Journal of Clinical and Laboratory Investigation, 31, 465-472.
Hall, C. C. (1973). Polyethylene mixing coils in automated
immuno-nephelometric assay. Clinica chimica acta, 46,
21-2.5.
Hobbs, J. R. (1970). Simplified radial immunodiffusion.
Association of Clinical Pathologists Broadsheet, 68, 1-8.
Kahan, J., and Sundblat, L. (1967). Automated Immuno-
85
chemical Determination of {J-Lipoprotein. Techicon International Symposia 196.5-1967-Automation in Analytical
Chemistry, volume 2, pp. 361-364. Medaid Inc. : New York.
Lauren, CoB. (1972). Electroimmunoassay. Scandinavian
Journal of Clinical and Laboratory Investigation, 29,
Supplement 124, 21-37.
Libby, R. L. (1938). The photonreflectometer; an instrument
for the measurement of turbid systems. Journal of Immunology, 34, 71-73.
Lizana, J., and Hellsing, K. (1974). Manual immunonephelometric assay of proteins with the use of polymer enhancement. Clinical Chemistry, 20, 1181-1186.
Maddison, S. E., and Reimer, C. B. (1976). Normative
values of serum immunoglobulins by single radial immunodiffusion. A review. Clinical Chemistry, 22, .594-601.
Massey, F. J. (1951). The Kolmogorov-Smirnov test of
goodness of fit. Journal of the American Statistical
Association, 46, 68-78.
Reed, A. H., Henry, R. J., and Mason, W. B. (1971).
Influence of the statistical method used on the resulting
estimate of normal range. Clinical Chemistry, 17,27.5-284.
Accepted for publication 21 September 1977
Downloaded from acb.sagepub.com by guest on January 20, 2015
© Copyright 2026 ExpyDoc