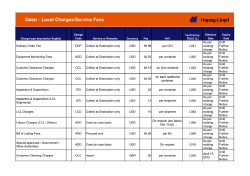
INDEX INSIGHTS
Contact Information
Joseph LaCorte, CFA
S-Network Global Indexes Inc.
(646) 467-7927
[email protected]
Q2 2014 Review: CEFX
Index Performance. The S-Network Composite Closed-End Fund Index (TICKER: CEFX) increased +3.34% from 759.47
to 784.85 in the quarter ended June 2014. The S-Network Composite Closed-End Fund Total Return Index
(TICKER: CEFXTR), which includes dividends, was up +5.33%.
As of June 30, 2014, the dividend yield for the index was +8.15%, compared with +8.46% at the end of the previous
quarter. The weighted discount for the index was -6.47% as of June 30, 2014, compared with -7.58% at the end of the
previous quarter.
The S-Network Composite Closed-End Fund Index rose +4.15% in the past 12 months. This compares to a +13.07% rise in
the S-Network Composite Closed-End Fund Total Return Index.
Licensed ETF
PowerShares CEF Income Composite
Portfolio Fund
Ticker: PCEF
Index Description. The The S-Network Composite Closed-End Fund Index (TICKER: CEFX) is a fund index designed to
serve as a benchmark for closed-end funds listed in the US that principally engage in asset management processes seeking
to produce taxable annual yield. The CEFX employs a modified net assets weighting methodology designed to assure
accurate investment exposure across the various style segments that together comprise the taxable yield sector of the
closed-end fund market. The CEFX is divided into three main closed-end fund sectors: a) Investment Grade Fixed Income
Closed-End Funds; b) High-Yield Fixed Income Closed-End Funds; and c) Option Income Closed-End Funds.
This is not an offer to purchase or sell shares of the above listed
funds. All purchases or sales of shares must be pursuant to a current
private offering memorandum for the relevant fund or funds.
Inclusion Criteria. All The CEFX contains closed-end funds selected from a universe of approximately 200 closed-end
funds registered in the United States. All closed-end funds included in the CEFX must have as their stated objective one of
three categories used to distinguish sectors: a) fixed-income; b) high yield fixed-income; and c) option income. The
closed-end fund’s stock must trade on a regulated North American stock exchange that issues a last closing price. The
minimum capitalization value for any closed-end fund must be greater than USD 100 million and it must have an average
daily turnover of more than USD .5 million per day for the three months prior to the announcement date to be eligible for
inclusion. Constituents must have a total expense ratio of less than 2% per annum as of its most recent filing date.
Closed-end funds that have traded at average premiums of 20% or more to their net asset values for ten business days prior
to the last Friday of the month preceding the rebalancing date will be excluded from the index.
Information about the index, including
rule book, company description, and
historic data, can be found at:
www.closedendfundindex.com
Weighting Methodology. The CEFX employs a weighting methodology based on total net assets, adjusted for each
closed-end fund’s average discount for the previous 90 days. Funds trading at discounts greater than the average discount
of the constituents are accorded a higher weighting in the index, and funds that trade at a premium to the average have
their weightings reduced. Any stock with a weight greater than 8% of the index will be capped at 8% and the excess weight
will be redistributed on a proportional basis to the remaining stocks in the index. The total weight of stocks contained in the
index with weights greater than 5% will be capped at 45%. Excess weights of stocks with weights over 5% will be reduced on
a proportional basis and added to the weights of the stocks with weights under 5% on a proportional basis.
TICKERS:
Rebalancing. CEFX is rebalanced and reconstituted quarterly, at the close of trading on the last business day of the
rebalancing month.
S-Network Composite Closed-End
Fund Index : CEFX
SM
Index Data. CEFX contains 155 constituents, and index values are distributed throughout the day at fifteen-second intervals
in U.S. Dollars. CEFX is calculated on both a price only and total return basis. Daily values are available from December 31,
2005.
Current Yields
S-Network Composite Closed-End
10.00%
Fund Total Return IndexSM: CEFXTR
8.00%
8.15%
6.00%
4.00%
June 2014
2.13%
2.00%
0.00%
3.24%
2.53%
1.96%
0.62%
0.11%
1-Year US
Treasury
Inquire about our custom institutional
benchmarking services
7-Year US
Treasury
10-Year US
Treasury
2 year
Corporate AA
5 year
Corporate AA
10 year
Corporate AA
CEFX Index
S-Network Composite Closed-End Fund Index: Discount
-12.50%
-10.00%
- 9 . 73%
- 7 . 88%
-7.50%
- 8 . 18%
- 6 . 47%
-5.00%
- 4 . 35%
- 5 . 04%
- 3 . 75%
- 4 . 09%
- 3 . 88%
- 7 . 58%
- 6 . 47%
- 4 . 24%
- 5 . 13%
- 5 . 36%
-2.50%
0.00%
Dec-08 Jun-09 Dec-09 Jun-10 Dec-10 Jun-11 Dec-11 Jun-12 Dec-12 Jun-13 Sep-13 Dec-13 Mar-14 Jun-14
Data Source: Bloomberg
Data as of June 30, 2014
This material has been prepared and/or issued by S-Network Global Indexes Inc. and/or one of its consultants or affiliates. This document is for information purposes only and it should not be regarded as an offer to sell or as a solicitation of
an offer to buy the securities or other instruments mentioned in it. The information, including any third party information, may not be accurate or complete in its entirety, and it should not be relied upon as such. S-Network Global Indexes Inc.
and/ or its affiliates are not acting in a fiduciary capacity. The products mentioned herein may not be eligible for sale in some states or countries and may not be suitable for all investors. The potential yield created by these products may be
adversely affected by exchange rates, interest rates, or other economic and political factors. An investor’s return may be less than the principle invested. In addition, S-Network Global Indexes Inc., its shareholders, directors, officers, and/or
employees and consultants, may from time to time hold a long or short position in these securities. This document may not be reproduced in any manner without the prior written authorization of S-Network Global Indexes Inc.. Opinions
expressed within reflect the opinions of S-Network Global Indexes Inc. and the author/analyst and are subject to change without notice.
“S-Network Composite Closed-End Fund Index” is a service mark of S-Network Global Indexes Inc.
©2014 S-Network Global Indexes Inc., 267 Fifth Avenue, New York, NY 10016.
INDEX INSIGHTS
Index Statistical Profile
Top Ten Holdings
FUND NAME
TICKER
SECTOR
WEIGHT
AUM
EATON VANCE TAX-MANAGED GLOBAL DIVERSIFIED EQUITY INCOME FUND
PIMCO DYNAMIC CREDIT INCOME FUND
EXG US
OPTION INCOME
3.78%
3.13 BILLION USD
PCI US
INVESTMENT GRADE FIXED INCOME
3.13%
3.27 BILLION USD
ALLIANCEBERNSTEIN INCOME FUND INC
ACG US
INVESTMENT GRADE FIXED INCOME
2.47%
1.83 BILLION USD
EATON VANCE DURATION INCOME FUND LTD
EVV US
INVESTMENT GRADE FIXED INCOME
2.14%
1.83 BILLION USD
EATON VANCE TAX-MANAGED DIVERSIFIED EQUITY INCOME FUND
ETY US
OPTION INCOME
2.08%
1.75 BILLION USD
BLACKROCK CREDIT ALLOCATION INCOME TRUST
BTZ US
INVESTMENT GRADE FIXED INCOME
2.04%
1.49 BILLION USD
BLACKROCK ENHANCED EQUITY DIVIDEND TRUST
BDJ US
OPTION INCOME
2.02%
1.51 BILLION USD
ABERDEEN ASIA-PACIFIC INCOME FUND INC
FAX US
INVESTMENT GRADE FIXED INCOME
2.00%
1.67 BILLION USD
DOUBLELINE INCOME SOLUTIONS FUND
DSL US
HIGH YIELD FIXED INCOME
1.99%
2.07 BILLION USD
DNP SELECT INCOME FUND INC
DNP US
INVESTMENT GRADE FIXED INCOME
1.93%
2.84 BILLION USD
Capitalization Profile
Number of Constituents
155
TOTAL MARKET CAPITALIZATION
91.61 BILLION USD
LARGEST MARKET CAPITALIZATION
3.27 BILLION USD
SMALLEST MARKET CAPITALIZATION
113.76 MILLION USD
AVERAGE MARKET CAPITALIZATION
591.06 MILLION USD
MEDIAN MARKET CAPITALIZATION
393.73 MILLION USD
Index Composition
S-Network Composite Closed-End Fund Index: Sector Breakdown
High Yield Fixed
Income
24.29%
Investment Grade
Fixed Income
48.95%
Option Income
26.76%
S-Network Composite Closed-End Fund Index: Manager Breakdown
Others
28.62%
Franklin Advisers Inc
2.26%
John Hancock
Advisers LLC
2.84%
Voya Investments
LLC
3.21%
First Trust Advisors
3.48%
Alliance Bernstein LP
3.66%
BlackRock Advisors
LLC
17.60%
Eaton Vance
Management
14.30%
Nuveen Asset
Management LLC
12.43%
Allianz Global
Investors Fund
Management LLC
Legg Mason Partners
7.11%
Fund Advisor LLC
4.49%
Data Source: Bloomberg
Data as of June 30, 2014
© Copyright 2026 ExpyDoc