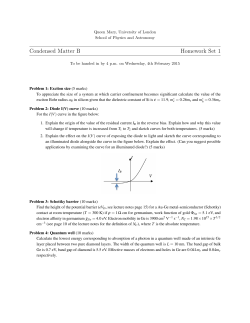
Applied Soft Computing 23 (2014) 122–127
Contents lists available at ScienceDirect
Applied Soft Computing
journal homepage: www.elsevier.com/locate/asoc
A novel context sensitive multilevel thresholding for image
segmentation
Swarnajyoti Patra a,∗ , Rahul Gautam b , Anshu Singla b
a
b
Department of Computer Science and Engineering, Tezpur University, Tezpur 784028, India
School of Mathematics and Computer Applications, Thapar University, Patiala 147004, India
a r t i c l e
i n f o
Article history:
Received 12 July 2013
Received in revised form 8 May 2014
Accepted 11 June 2014
Available online 19 June 2014
Keywords:
Entropy
Genetic algorithm
Histogram
Image segmentation
Thresholding
a b s t r a c t
Most of the traditional histogram-based thresholding techniques are effective for bi-level thresholding
and unable to consider spatial contextual information of the image for selecting optimal threshold. In
this article a novel thresholding technique is presented by proposing an energy function to generate
the energy curve of an image by taking into an account the spatial contextual information of the image.
The behavior of this energy curve is very much similar to the histogram of the image. To incorporate
spatial contextual information of the image for threshold selection process, this energy curve is used as
an input of our technique instead of histogram. Moreover, to mitigate multilevel thresholding problem
the properties of genetic algorithm are exploited. The proposed algorithm is evaluated on the number of
different types of images using a validity measure. The results of the proposed technique are compared
with those obtained by using histogram of the image and also with an existing genetic algorithm based
context sensitive technique. The comparisons confirmed the effectiveness of the proposed technique.
© 2014 Elsevier B.V. All rights reserved.
Introduction
Image segmentation plays an important role in image analysis
and computer vision. It is often used to partition an image into
separate regions, which ideally correspond to different real-world
objects. Thresholding is one of the most important and effective
method for image segmentation. Due to the advantage of smaller
storage space, fast processing speed and ease in manipulation,
thresholding techniques have drawn a lot of attention during the
last couple of decades. Since thresholding is a well-researched field,
there exist many algorithms for determining an optimal threshold
of the image. A survey of thresholding methods and their applications exist in literature [1].
Thresholding techniques can be divided into bi-level and multilevel category, depending on the number of thresholds required
to be detected. In bi-level thresholding, an image is segmented into
two different regions depending on a threshold value selected from
the histogram of the image [2–10]. The pixels with gray values
greater than the threshold value are assigned into object region,
and the rest are assigned into background. Multilevel thresholding segments a gray level image into several distinct regions by
detecting more than one thresholds [11–13]. Otsu’s method [2] is
∗ Corresponding author. Tel.: +91 9434996199.
E-mail address: [email protected] (S. Patra).
http://dx.doi.org/10.1016/j.asoc.2014.06.016
1568-4946/© 2014 Elsevier B.V. All rights reserved.
one of the popular histogram thresholding method that chooses
an optimal threshold by maximizing the between class variance.
The minimum error thresholding methods [3,4] defined a criterion
based on the assumption that the object and background pixels
are normally distributed and the optimum threshold is achieved
by optimizing a criterion function related to the Bayes risk. In Pun’s
method [5], as modified by Kapur et al. [6], the threshold is determined by maximizing the entropy of the object and background
pixels. Kwon’s [7] proposed a threshold selection method based on
the cluster analysis. In [8] a thresholding criterion is formulated by
exploring the knowledge about intensity contrast. Huang and Wang
[9] introduced fuzzy entropy measure to select optimum threshold
from the histogram. In [10], Liu et al. proposed a thresholding technique that selects an optimal threshold based on a fuzzy entropy
measure which considers both inter class distinctness and intra
class variation.
Traditional thresholding techniques based on histogram of the
image suffered two major limitations [2,3,6,9]: (i) Unable to consider contextual information for selecting optimum threshold. (ii)
Inefficient for multilevel thresholding as computationally demanding and complicated to implement. To mitigate the first limitation,
an energy function is proposed. This energy function computes the
energy of an image at each gray value by taking into an account the
spatial contextual information of the image. The characteristics of
this energy curve is similar to the histogram of an image i.e., if the
energy curve of an image includes peaks, we can separate it into a
S. Patra et al. / Applied Soft Computing 23 (2014) 122–127
123
C = {cij , 1 ≤ i ≤ m, 1 ≤ j ≤ n} be another matrix such that cij = 1, ∀ (i, j).
Then energy value El of the image I at gray value l is defined as:
n
m
El = −
i=1 j=1 pq∈N 2
ij
Fig. 1. N2 neighborhood of pixel (i, j).
number of modes. Each mode is expected to correspond to a region,
and there exists a threshold at the valley between any two adjacent
modes [14]. Thus, with the help of proposed energy curve instead of
histogram of the image, we incorporated spatial contextual information in the threshold selection process. To mitigate the second
limitation, we exploited the properties of genetic algorithm (GA)
[15–17]. The fitness function of the genetic algorithm is modeled
by extending the criterion proposed in [6]. In order to show the
validity of the proposed approach four different images are used
and results are compared with those obtained by using histogram
of the image and also with an existing GA-based context sensitive
technique [16].
The rest of this paper is organized as follows. The proposed
technique is presented in Section “Proposed method”. Section
“Experimental results” provides the detailed description of the
experimental settings and the results obtained on the considered
images. Finally, Section “Discussion and conclusion” draws the conclusion of this work.
Proposed method
Histogram-based thresholding techniques are unable to consider the spatial contextual information of the image to find out
appropriate thresholds [1]. In this work we proposed an energy
curve similar to the histogram of an image by taking into an account
the spatial contextual information of the image. The energy curve
obtained is used further for selecting the optimal threshold of the
image.
Energy curve
Let I = {lij , 1 ≤ i ≤ m, 1 ≤ j ≤ n} be an image of size m × n where
lij is the gray value of image I at pixel position (i, j). Let L be
the maximum gray value of the image I. The spatial correlation
between neighboring pixels of the image I is modeled by defining
the neighborhood system N of order d, for given spatial position
(i, j) as Nijd = {(i + u, j + v), (u, v) ∈ N d }. According to the value of d,
the neighborhood system assume different configurations [18]. In
this work, only the second-order neighborhood systems is considered, i.e., (u, v) ∈ {(±1, 0), (0, ±1), (1, ±1), (−1, ±1)}. Fig. 1 depicts
second-order (N2 ) neighbor pixels of the pixel at spatial position(i,
j).
To compute the energy of the image I at gray value l(0 ≤ l ≤ L),
first we generated a two-dimensional binary matrix Bl = {bij ,
1 ≤ i ≤ m, 1 ≤ j ≤ n} such that bij = 1 if lij > l; else bij = −1. Thus, the
value of each element bij in Bl is assigned either 1 or −1 depending
on the gray value lij of the corresponding pixel and the value of l. Let
bij .bpq +
n
m
cij .cpq
(1)
i=1 j=1 pq∈N 2
ij
The second term of the expression written on the right side of
(1) is a constant term and ensures the energy value El ≥ 0. From
(1), one can see that for an image I, the energy value at gray level
l will be zero when all the elements of the generated matrix Bl are
either 1 or −1 i.e., all the pixels of the image I has gray values either
greater than l or less than l. Otherwise, the energy will be positive as
shown in Fig. 2(i)–(l). The proposed approach computes the energy
associated with each gray value of the image to generate the energy
curve by taking into account the spatial contextual information of
the image.
Characteristics of the energy curve
The energy curve obtained in (1) has some interesting characteristics. Let the gray values of the pixels in the range [t1 , t2 ] represent
an object in the image. For l = t1 , the elements in matrix Bl corresponding to the pixels in the object will be 1. If we increase the value
of l, few elements in Bl matrix will change from 1 to −1, as a result
energy will increase. The energy increases up to certain value of l
and then decreases as the neighbor entries in Bl also change from 1
to −1. For l = t2 , all the entries in Bl correspond to the pixels in the
object will be −1. Thus, a bell shape energy curve will be generated
in the range [t1 , t2 ].
Fig. 2 shows the different images, their corresponding histograms and energy curves. From this figure one can see that like
histogram, the energy curve also contain valleys and peaks to represent different objects of the image. Each mode of the energy curve
correspond to a region of the image that represent similar objects.
There exists a valley between any two adjacent modes. Thus, our
proposed energy curve behaves like a histogram of an image where
we need to find out thresholds passing through the valley regions of
the energy curve for segmenting the image. Since the energy curve
is generated taking into an account spatial contextual information
of the image, it is more smooth and clearly discriminate different
objects in the image as compared to the histogram. Thus, becomes
more effective to detect appropriate thresholds.
Multiple thresholds selection using genetic algorithm
Once energy curve of an image is obtained, any existing
histogram-based thresholding technique [2–6,10] can be applied
for detecting optimal threshold. Most of the existing histogrambased thresholding techniques are effective for detecting single
threshold. For multilevel thresholding, their computational complexity increases exponentially and also complicated to implement.
To overcome this problem, in this work we exploited GA. The basic
steps of GA, also followed in the thresholds selection, are now
described in detail.
Chromosome representation: Each chromosome is a sequence
of binary numbers representing the k thresholds. If s bits are used
to represent a threshold value then the length of a chromosome is
k × s bits, with the first s bits (or, genes) are used to represent the
first threshold, the next s bits represent the second threshold, and
so on.
Population initialization: Population is a collection of chromosomes. The total number of chromosomes belong to a population
is called the size of the population. The threshold values in each
chromosome are initialized randomly.
124
S. Patra et al. / Applied Soft Computing 23 (2014) 122–127
Fig. 2. Original images: (a) fingerprint, (b) cameraman, (c) man and (d) Lena. Histogram of the images: (e) fingerprint, (f) cameraman, (g) man and (h) Lena. Energy curve of
the images: (i) fingerprint, (j) cameraman, (k) man and (l) Lena.
Fitness computation: Fitness function is the most important
component of GA. To compute fitness value of each chromosome
in the population, we exploited the entropy based threshold selection criterion presented in [6] that already shows its robustness in
many applications [19,20]. This entropy based criterion is briefly
described as follows.
Let ω1 and ω2 be two classes represent back ground and object
of an image and H be the histogram of the image represent the
S. Patra et al. / Applied Soft Computing 23 (2014) 122–127
probability of occurrence of gray level l as pl . Assuming a threshold
t, the entropies of classes ω1 and ω2 (donated as EN ω1 and EN ω2 ,
respectively) are computed as follows:
t
pl
EN ω1 = −
l=0
L−1
EN ω2 = −
Pω1
log2
p
l
l=t+1
Pω2
pl
Pω1
log2
pl
Pω2
(2)
t
=
⎧ tj
p
⎪
p
⎪
l
⎪
−
log2 l ,
⎪
⎪
P
P
ωj
ωj
⎪
⎪
l=0
⎪
⎪
tj
⎪
⎪
⎪
p
⎨ p
−
l
Pωj
log2
l
Pωj
if j = 1
,
l=tj−1 +1
⎪
⎪
⎪
L−1
⎪
⎪
pl
p
⎪
⎪
log2 l ,
−
⎪
⎪
Pωj
Pωj
⎪
⎪
⎪
⎩ l=tj +1
if 1 < j < k
if j = k
Then the total entropy will be:
Experimental study presented here provides an evidence of
the effectiveness of the proposed technique. Below we reported
a details description of the experimental setup and then analyzed
the results.
Description of the experiments
In order to asses the effectiveness of the proposed method,
the results of this method are compared with those obtained by
using histogram of the image (we may refer this as histogrambased technique) and also an existing GA-based context sensitive
(GACS) technique [16]. The GA-based technique presented in [16]
is a clustering technique. To adopt this technique for solving image
segmentation problem, first the input patterns are generated corresponding to each pixel of the image. The generated input patterns
included neighboring pixels information in order to take contextual
information of the image. In this experiment 1st order neighborhood is considered. The input vectors contain two components,
the gray value of the pixel and the average gray value of its four
neighboring pixels. After generating the input patterns, the GACS
technique presented in [16] is used to find out the cluster representatives for segmenting the image.
For all the considered images, the population size of GA is taken
as twenty and stochastic selection strategy is used to select fittest
chromosomes from the matting pool. The crossover and mutation
probability is set as 0.8 and 0.01, respectively, and number of iterations set as terminating criterion of GA is taken as 1000. All these
parameters of GA are set manually by varying their values in a wide
range, where results are not changed significantly.
In order to evaluate the segmented results obtained by different
approaches, a validity measure called Davies Bouldin (DB) index is
used. It is a function of the ratio of the sum of within-object scatter
to between-object separation. Let ω1 , ω2 , . . ., ωk be the k objects
defined by thresholds t1 < t2 < t3 , . . ., < tk−1 . Then the DB index is
defined as:
i2 + j2
Rij =
k
EN =
Experimental results
,
where Pω1 =
p and Pω2 = 1 − Pω1 . To select a threshold on the
l=0 l
histogram that properly discriminate the back ground and object
pixels in an image (i.e., passes through the valley region of the
histogram), the entropies of classes ω1 and ω2 are computed by
assuming all possible values of the threshold t. Then, the optimal
threshold is selected by maximizing the total entropy EN ω1 + EN ω2 .
If the image contains multiple objects with different gray values
then we need to find out multiple thresholds to separate one object
from other. Here we extended this criterion for multilevel thresholding as follows.
Let ω1 , ω2 , . . ., ωk are the k objects of an image separated from
each other by defining thresholds t1 , t2 , . . ., tk−1 , where t1 < t2 < t3 ,
. . ., < tk−1 . The entropy of jth object is computed as:
EN ωj
EN ωj
125
(3)
j=1
In the proposed method we used energy function defined in (1)
in place of histogram to compute the probability pl at l. Then the
thresholds represented by a chromosome are used to compute its
fitness value using (3).
Selection: The selection process select chromosomes from the
mating pool directed by the survival of the fittest concept of natural genetic systems. The selection strategy ’stochastic uniform’ has
been adopted here.
Crossover: Crossover exchanges information between two parent chromosomes for generating two child chromosomes. The
chromosomes of length k × s, the crossover points are randomly
generated in the range [1, k × s − 1].
Mutation: Each chromosome undergoes mutation with a fixed
probability. Chromosomes in the population, a bit position (or gene)
is mutated by simply flipping its value.
Termination criterion: The processes of fitness value computation, selection, crossover, and mutation are executed for a
maximum number of iterations.
After termination criterion is satisfied, the chromosome in the
population that has maximum fitness value is considered for selecting the optimal thresholds. Then depending on these threshold
values the image is segmented for discriminating the different
homogeneous regions of the image.
Ri =
dij2
max
j=1,...,k.,i =
/ j
k
DB =
{Rij }
(4)
1
Ri ,
k
i=1
where i2
and dij2 is
and j2 are the variances of object ωi and ωj , respectively,
the distance of object centers ωi and ωj . Because a low
scatter/variance and a high distance between objects lead to small
values of Rij , as a result small value of DB correspond to objects
that are compact and have centers far away from each other. So the
smaller the DB value, the better the segmentation is. All the algorithms presented in this paper have been implemented in Matlab
(R2012b).
Analysis of results
In the present experiment four different images: the fingerprint,
the cameraman, the man and the Lena are used for the experimental validation. Fig. 2 shows the original images, corresponding
histograms and energy curves. From these figures one can see that
the behavior of the energy curve is similar to the histogram of the
image (explained in Section “Characteristics of the energy curve”).
Moreover, the generated energy curve is much smoother than the
histogram of an image. This may help us to select better thresholds
by considering energy curve of the image instead of histogram.
126
S. Patra et al. / Applied Soft Computing 23 (2014) 122–127
Table 1
Quantitative results obtained by using proposed energy-based, histogram-based and GACS techniques. Smaller DB values indicate better performance
Image
Energy
Histogram
GACS
Selected thresholds
DB
Selected thresholds
DB
Cluster representatives
DB
Fingerprint
124
97, 151
83, 122, 162
.029
.164
.111
154
87, 168
107, 141, 178
.057
.266
.154
{(64.1, 93.3),(186.8,168.2)}
{(62.0,90.9),(157.5,158.2),(191.8,169.8)}
{(60.4,90.1),(94.6,139.7),(180.5,158.9),(194.1,192.8)}
.062
.606
.357
Cameraman
125
80, 160
62, 128, 190
.049
.148
.171
167
47, 141
37, 126, 180
.154
.142
.183
{(21.2, 24.7),(196.2,193.9)}
{(16.8, 21.0),(157.9,157.6),(211.9,208.2)}
{(10.9, 10.7),(77.2,88.2),(171.6,161.3),(206.4,205.0)}
.048
.227
.252
Man
101
71, 132
67, 124, 181
.033
.121
.159
138
33, 113
38, 121, 183
.105
.164
.179
{(21.7, 40.2),(161.9, 147.3)}
{(19.1,38.9),(169.2,105.3),(161.1,161.2)}
{(14.1,65.1),(18.5,18.1),(140.8,105.6),(166.8,161.7)}
.069
.399
.332
Lena
131
99,164
83, 131, 178
.239
.181
.160
123
97, 164
91, 129, 178
.219
.181
.164
{(73.8, 74.1),(155.7,154.9)}
{(62.9,63.6),(130.7,129.9),(186.4,185.4)}
{(56.7,57.3),(98.9,98.9),(146.2,145.5),(203.7,201.9)}
.202
.194
.165
Table 1 reported the quantitative results obtained by using
energy-based, histogram-based and GACS techniques. From the
table one can see that except the Lena image, the DB values obtained
by the proposed energy-based method are always better or similar
to the DB values obtained by the histogram-based and GACS methods. Moreover by analyzing the results reported in Table 1 and the
histogram of the images shown in Fig. 2(e)–(h), one can conclude
that for bi-level thresholding/segmentation, except the Lena image,
for all the other images the proposed energy-based method outperformed than both the existing methods. For example consider
the results of the fingerprint image shown in Table 1. The threshold selected by the proposed and the histogram-based method is
124 and 154, respectively. From Fig. 2(e) one can see that 124 is a
better threshold than 154 to segment the fingerprint image. This is
also confirmed by obtaining smaller DB value 0.029 associated with
the threshold value 124 compared to the DB value 0.057 associated
with the threshold value 154. The GACS method selected two cluster representatives (64.1,93.3) and (186.8,168.2) for segmenting
the fingerprint image and obtained 0.062 DB value which is larger
than the DB value produced by the proposed technique (i.e., 0.029).
Since the histogram of the Lena image is multimodal, (see Fig. 2(h))
the proposed technique failed to produce better result for bi-level
thresholding. When the number of segments increased it produced
better results compared to the other two existing techniques. For
a visual qualitative analysis, Fig. 3 shows the bi-level segmented
results obtained on the fingerprint, the cameraman, the man and
Fig. 3. Bi-level segmented images obtained for fingerprint, cameraman, man and Lena images by applying (a)–(d) proposed energy-based, (e)–(h) histogram-based and (i)–(l)
GACS methods.
S. Patra et al. / Applied Soft Computing 23 (2014) 122–127
the Lena images by applying energy-based, histogram-based and
GACS techniques. From these segmented images one can see that
the proposed technique always produced satisfactory results.
Discussion and conclusion
Histogram-based traditional thresholding techniques are
unable to consider spatial contextual information for selecting the
optimum threshold and are effective only for bi-level thresholding.
In this article a novel thresholding technique is presented that
mitigate both these limitations. First, we proposed an energy
function to compute the energy value of the image at each gray
value by taking into an account the spatial contextual information
of the image. This energy value is computed in such a way that
the characteristic of the energy curve becomes similar to the
histogram of the image. Thus, by using the energy curve instead of
using histogram, we incorporated spatial contextual information
in threshold selection process. Second, to mitigate multilevel
thresholding problem, GA is exploited. The fitness function of the
GA is modeled by extending the criterion proposed in [6].
To empirically assess the effectiveness of the proposed method,
we compared it with two other methods exist in the literature by
using four different images. In this comparison, we observed that
the proposed method provided better results as compared to the
other techniques. As a future developments of this work, we plan to
extend it for finding optimal number of thresholds automatically.
References
[1] M. Sezgin, B. Sankur, Survey over image thresholding techniques and quantitative performance evaluation, J. Electron. Imaging 13 (1) (2004) 146–165.
[2] N. Otsu, A threshold selection method from gray level histograms, IEEE Trans.
Syst. Man Cybernet. 9 (1979) 62–66.
127
[3] J. Kittler, J. Illingworth, Minimum error thresholding, Pattern Recogn. 19 (1)
(1986) 41–47.
[4] S. Cho, R. Haralick, S. Yi, Improvement of Kittler and Illingworth, minimum error
thresholding, Pattern Recogn. 22 (5) (1989) 609–617.
[5] T. Pun, A new method gray-level picture thresholding using the entropy of the
histogram, Signal Process. 2 (1980) 223–237.
[6] J.N. Kapur, P.K. Sahoo, A.K.C. Wong, A new method for gray-level picture thresholding using the entropy of the histogram, Comput. Vision Graphics Image
Process. 29 (3) (1985) 273–285.
[7] S.H. Kwon, Threshold selection based on cluster analysis, Pattern Recogn. Lett.
25 (2004) 1045–1050.
[8] Y. Qiaoa, Q. Hua, G. Qiana, S. Luob, W.L. Nowinskia, Thresholding based on
variance and intensity contrast, Pattern Recogn. 40 (2007) 596–608.
[9] L.K. Huang, M.J.J. Wang, Image thresholding by minimizing the measures of
fuzziness, Pattern Recogn. 28 (1995) 41–51.
[10] D. Liu, Z. Jiang, H. Feng, A novel fuzzy classification entropy approach to image
thresholding, Pattern Recogn. Lett. 27 (2006) 1968–1975.
[11] S.K. Pal, D. Dutta Majumder, Fuzzy Mathematical Approach to Pattern Recognition, John Wiley, Halsted Press, New York, 1986.
[12] C.C. Chang, L.L. Wang, A fast multilevel thresholding method based on lowpass
and highpass filter, Pattern Recogn. Lett. 18 (1997) 1469–1478.
[13] L.K. Huang, M.J.J. Wang, Thresholding technique with adaptive window
selection for uneven lighting image, Pattern Recogn. Lett. 26 (2005)
801–808.
[14] H.D. Cheng, X.H. Jiang, J. Wang, Color image segmentation based on homogram
thresholding and region merging, Pattern Recogn. 35 (2002) 373–393.
[15] D.E. Goldberg, Genetic Algorithms in Search, Optimization and Machine Learning, Addison-Wesley, New York, 1989.
[16] U. Maulik, S. Bandyopadhyay, Genetic algorithm-based clustering technique,
Pattern Recogn. 33 (2000) 1455–1965.
[17] Y. Liang, K.-S. Leung, Genetic algorithm with adaptive elitist-population strategies for multimodal function optimization, Appl. Soft Comput. 11 (2) (2011)
2017–2034.
[18] S. Ghosh, L. Bruzzone, S. Patra, F. Bovolo, A. Ghosh, A context-sensitive
technique for unsupervised change detection based on Hopfield-type neural
networks, IEEE Trans. Geosci. Remote Sens. 45 (3) (2007) 778–789.
[19] P.L. Rosin, E. Ioannidis, Evaluation of global image thresholding for change
detection, Pattern Recogn. Lett. 24 (2003) 2345–2356.
[20] S. Patra, S. Ghosh, A. Ghosh, Histogram thresholding for unsupervised change
detection of remote sensing images, Int. J. Remote Sens. 32 (21) (2011)
6071–6089.
© Copyright 2026 ExpyDoc