Australian Journal of Basic and Applied Sciences, 8(9) June 2014, Pages: 375-382
AENSI Journals
Australian Journal of Basic and Applied Sciences
ISSN:1991-8178
Journal home page: www.ajbasweb.com
Stock Price Prediction of Oil and Gas Corporation using Modified Genetic Algorithm
Simulated Annealing Approach
1
S.Kopperundevi and 2DR.A.Iyemperumal
1
Research Scholar, Dr.M.G.R.Educational And Research Institute,University, Chennai, Tamil Nadu, India.
Professor, Department of Mathematics, Dr.M.G.R.Educational And Research Institute,Unrsity, Chennai, Tamil Nadu, India.
2
ARTICLE INFO
Article history:
Received 2 March 2014
Received in revised form
13 May 2014
Accepted 28 May 2014
Available online 23 June 2014
Keywords:
Artificial neural network, Genetic
Algorithm, Simulated Annealing, Stock
Price
ABSTRACT
Background:Stock Market is amessy place for predicting since there are no significant
rules to estimate or predict the price of shares in the stock market. Many methods like
technical analysis, fundamental analysis, time series analysis and statistical analysis,
etc. are all used to attempt to forecast the price in the stock market, but none of these
methods are proven as a consistently acceptable prediction tool. Objective:In this
paper, an artificial neural network based on Modified Genetic Algorithm-Simulated
Annealing (MGASA) is used to predict the stock price index.In designing the model,
the data of oil and gas company is taken from Bombay Stock Exchange (BSE) (20102014).Result: The network is trained by 60% of the experimental data. 30% of the
essential information which had been acknowledged for testing the appropriateness has
been fed into the model. The predicted values were compared with the experimental
values for evaluating the performance. The result obtained by using MGASA are in
astounding concurrence with the experimental results and has high execution in stock
price prediction.Conclusion:It is observed that the proposed algorithm significantly
outperforms resulting in more profits. Hence, it can be concluded that the proposed
algorithm is well suited for prediction of the stock prices.
© 2014 AENSI Publisher All rights reserved.
To Cite This Article: S.Kopperundevi and DR.A.Iyemperumal., Stock Price Prediction of Oil and Gas Corporation using Modified Genetic
Algorithm Simulated Annealing Approach. Aust. J. Basic & Appl. Sci., 8(9): 375-382, 2014
INTRODUCTION
Stock market statistics play a vital role in hypothetical research, especially in the past decades. An
important hypothesis related to the stock market, which has been debated and researched time and again is EMH
(Efficient Market Hypothesis). According to the EMH, the stock market immediately reflects all of the
information available publicly. But in reality, the stock market is not that efficient, so the prediction of stock
market is possible.
Stock market prediction is an act of attempting to determine the upcoming value of a business stock traded
on financial exchange. This would yield a considerable profit in business.
Many methods like technical analysis, fundamental analysis, and time series analysis are used to predict
stock market price, where time series analysis seeks to determine the future price of a stock based only on the
probable past price. Researchers analyzed and faced that the standard time series models have numerous
drawbacks in precision and robustness. There is no experimental evidence of linearity in stock returns, various
researchers and financial experts have focused on the nonlinear prediction methods.
The hybrid GS network as a potential stock market analysis tool, which is a combination of Neural Network
and Genetic Algorithm, has been used by Robert Verner for stock market prediction, a field of Artificial
Intelligence is capable of providing a better result in predicting the financial market to help finance practitioners
to make qualitative decisions but it has an overhead of higher computational requirements and time.
This paper proposes Modified Genetic Algorithm and Simulated Annealing Network (MGSN) and applied
to Oil and Gas Stock Price Prediction and produces higher quality solutions and overheads less computation
time. The results obtained from these applications have proved that the MGSN has the ability of addressing
large and complex problems and minimizing the MSE error value in training and testing period by improving an
accuracy in Oil and Gas Stock Price Prediction and is a new promising prediction algorithm for stock market
forecasting.
Related Works:
Corresponding Author: S.Kopperundevi, Research Scholar, Dr.M.G.R.Educational And Research Institute,University,
Chennai, Tamil Nadu, India.
376
S.Kopperundevi and DR.A.Iyemperumal, 2014
Australian Journal of Basic and Applied Sciences, 8(9) June 2014, Pages: 375-382
Computers play a vital role in each and every field, especially in stock markets. Before the invention of
computers, Shareholders and Financiers initially forecasted stocks based on their intuition. This helped financial
practitioners to make decisions on price prediction on stock values. The vast improvement in trading stocks and
shares force us to find a better mechanism, with the help of computers, to predict the stock price in a short
period of time with more accuracy in order to upturn profits, thus diminish losses.
Several research efforts were carried out to observe the forecasted price in stock markets. Various
techniques like fundamental analysis, technical analysis, and time series analysis, data mining techniques,
machine learning algorithms, chaos theory and linear regression and machine learning algorithms have been
used to predict stock market data. Researchers analyzed and faced that the above mentioned models have
numerous shortcomings in precision and robustness of statistics.
The technical analysis and fundamental analysis take a long time to respond to a company about stock
price. Time series analysis seeks to determine the future price of a stock based only on the probable past price.
There is no experimental evidence of linearity in stock returns, various researchers and financial experts have
focused on the nonlinear prediction methods. Hybridized approach, a data mining technique, improved approach
of technical and fundamental analysis provides enhanced accuracy of stock prediction, which is not attempted to
fix the critical effect of specific analysis variables.
Support Vector Machine (SVM) (Huang et al., 2005) and Reinforcement Learning, a Machine Learning
Algorithms (Vatsal H. Shah), which are intended to accumulate data from numerous global financial markets
makes the algorithm slower to calculate the imminent price of stock. Time Delay, Recurrent, and Probabilistic
Neural Networks have certain disadvantages like execution complexity, shortage of memory and require much
time for testing where each method is used to predict forthcoming value of a stock based on the history of dayto-day closing prices.
Artificial Neural Networks (ANNs) and Genetic Algorithms, a field of Artificial Intelligence is capable of
providing a better result in predicting the financial market to help finance practitioners to make qualitative
decision. There is a wide variety of research work on the applications of Neural Networks especially in finance
and stock markets. Artificial neural networks are competent inaccurate predictions without any specific
assumptions about variables and their effectiveness.
(Abdüsselam Altunkaynak ,2009) utilized a genetic algorithm for the forecasting of sediment load and
discharge. Very few have attempted to utilize just genetic algorithms to foresee stock prices. Since the genetic
algorithm can perform sensibly well by and large there must be an approach to anticipate stock price utilizing
GA .
Shaikh A. Hamid and Zahid Iqbal present a preparation for utilizing neural networks for financial
determining. They analyze instability estimates from neural networks with inferred unpredictability from S&p
500 Index future alternatives utilizing the Barone-Adesi and Whaley (BAW) American future alternatives
estimating model. Gauges from neural networks beat intimated unpredictability gauges and are most certainly
not discovered to be essentially unique in relation to acknowledged unpredictability (Shaikh, 2003). (David
Enke and Suraphan Thawornwong,2005) Presents an information gain procedure utilized as a part of machine
learning for information mining to assess the prescient connections of various finance related and investment
variables. Neural system models for level estimation and grouping are then analyzed for their capability to give
a compelling gauge of future qualities. (Zhang Yudong and Wu Lenan,2008) proposed an improved bacterial
chemo taxis enhancement (IBCO), which is then incorporated into the back propagation (BP) artificial neural
system to create an efficient anticipating model for expectation of different stock records. Experiments
demonstrate to its better performance over other systems in taking in capacity and generalization. (E.L. de Faria
and J.L. Gonzalez, 2009) performs a predictive investigation of the chief index of the Brazilian stock market
through artificialneural networks and the versatile exponential smoothing strategy. The target is to compare the
anticipating execution of both systems on this market record, also, specifically, to assess the exactness of both
systems to predict the indication of the market returns. Additionally the impact on the outcomes of a few
parameters associated with both systems is contemplated. Their effects demonstrate that both systems produce
comparative outcomes in regards to the prediction of the record returns. On the opposite, the neural networks
outperform the adjustable exponential smoothing strategy in the gauging of the market development, with
relative hit rates like the ones found in other created markets. (E.L. de Faria and J.L. Gonzalez, 2009)Performs a
prescient investigation of the principal index of the Brazilian stock exchange through artificial neural networks
and the versatile exponential smoothing strategy. The target is to compare the anticipating execution of both
routines on this business sector index, also, specifically, to assess the correctness of both techniques to anticipate
the indication of the business returns. Likewise the impact on the outcomes of a few parameters chatted to both
techniques is considered. Their effects demonstrate that both strategies produce comparative outcomes with
respect to the prediction of the index returns. On the opposite, the neural networks beat the versatile exponential
smoothing strategy in the determining of the business development, with relative hit rates like the ones found in
other developed markets.
377
S.Kopperundevi and DR.A.Iyemperumal, 2014
Australian Journal of Basic and Applied Sciences, 8(9) June 2014, Pages: 375-382
Financial forecasting is of respectable pragmatic investment furthermore, because of the artificial neural
network's capability to mine profitable data from a mass history of information; its provisions for financial
estimating have been extremely prominent in the course of the last few years (T. H. Roh, 2007). (Guresen, et al.,
2011)Reported the legitimacy of ANNs in stock business index prediction.
Sheng-Hsun Hsu and JJ Po-An Hsieh study utilizes a two-stage design for better stock price prediction.
Particularly, the self-organizing map (SOM) is initially used to deteriorate the entire information space in areas
where information focuses with comparable factual circulations are gathered together, in order to hold and catch
the non-stationary property of financial arrangement. In the wake of breaking down heterogeneous information
focuses into a few homogenous districts, support vector regression (SVR) is connected to predict financial
indices. The proposed system is experimentally tried utilizing stock price arrangement from seven significant
financial markets(Sheng-Hsun Hsu and JJ Po-An Hsieh, 2008).
The main objective of this paper involves in attempting to predict the intrinsic value of Oil and Gas in Stock
market. Following techniques forecast performance differences among different types of models and neural
network.
We introduced a new model, combination of Genetic Algorithm (GA) and Simulated Annealing (SA),
Modified G-S network for Oil and Gas Price Prediction, to improve on the existing approaches of forecasting
the upcoming value of Oil and Gas. Genetic Algorithm is an experimental scrutiny which provides the best
solution in specific time. Simulated Annealing is an effective technique to obtain a considerable future Oil and
Gas stock price by a specified amount of pride. But it fails in providing optimal solution. While combining these
two algorithms, we can be able to find a great solution to predict stock price value with minimal time for a
specific period irrespective of increasing time period. This will improve the solution presented here.
The stock price is changed time to time in microseconds, where it is more important to predict accurate
values of future price to get to profit in the stock exchange. This G-S Network allows contemplative analysis of
small and large set of statistics, especially those that have the tendency to oscillate within a short of period of
time.
The performance of this method is compared with other techniques. The Modified G-S Network would be a
best approach rather than a time series analysis, current Neural Networks and other methods. However, the
focus of this paper will improve accuracy in Oil and Gas Stock Price Prediction with a short period of time.
Basics of Genetic Algorithm and simulated annealing:
Genetic Algorithm:
Genetic algorithms (GA) are a particular kind of Evolutionary Algorithm (EA).The essential principles of
Genetic Algorithms (GAs) were proposed by Holland in 1975 (Holland JH ,1975). GAs are optimization and
search procedure that are based on the mechanics of biological evolution. They have been applied successfully
to solve a variety of complex problems (Beasley, D, Bull, D R and Martin, R, 2008). In general genetic
algorithm works as follows:
The general sketch of GA in pseudocode
Algorithm: GA(n, a,α):
i:=0;
pi=population of randomly selected individuals;
compute fitness(x) for each x € pi;
//Initialize generation
//Initialize generation
//Evaluate Pi
do:
1.select:
Select(1-a) × n members from pi and insert into pi+1;
2.crossover:
Select a × n members from pi; pair them upon and produce offspring; insert them into into
3.mutation:
Select α × n members from pi+1, invert a randomly selected bit
4.Evauate pi+1;
Compute fitness(x);
incrementi=i+1
while fitness(i) not high enough;
return fittest individual from pi
pi+1;
The algorithm starts with generating initial population randomly. Individuals from the population are
selected for reproduction based on their fitness value. The selected chromosomes are recombined (crossover)
and mutated to generate new population. The process is continued until a termination condition is met.
378
S.Kopperundevi and DR.A.Iyemperumal, 2014
Australian Journal of Basic and Applied Sciences, 8(9) June 2014, Pages: 375-382
Simulated Annealing:
Simulated annealing (SA) is a random-search technique [10] for combinatorial optimization problems to
search for feasible solution and converge to an optimal solution. The idea of SA is based on thermodynamics,
process of cooling metals (annealing). When you heat metal at a melting point and then gradually cooled, a large
crystals will be formed. If the fluid is cooled quickly the crystal will contain blemishes (Kirkpatrick., 1983). The
SA performs a random search on the range of values with metropolis criteria. The performance of SA is based
on the annealing schedule.
Simulated annealing is a straightforward algorithm for a set of optimization heuristic that searches for an
optimal neighborhood solution. The major benefit of SA over other traditional local search techniques is that its
potential to escape from local minima. The basic principle of SA is as follows:
Generate initial solution Sp
Set initial temperature t0
Set 0 < β < 1
Loop:
Select neighboring solution xi
Evaluate f(xi)
Calculate δf = f(xi) - f(xj)
if(δf< 0)
Thenxj= xi
Else
1
if −δf > random(0,1)
1+𝑒 𝑡
Thenxj= xi
Else
t( k+1) = β t(k)
until termination condition is met.
The algorithm starts with an initial solution. It then selects the neighborhood solution and evaluates the
objective function. The value of the objective function is better than the current solution, then it is accepted. It
also accepts worse quality solutions based on some probability. The process continues until the termination
condition is met (Roh, T.H., 2007).
Modified Genetic Algorithm and Simulated Annealing:
Genetic algorithms can save brilliant individuals for the following generation in the genetic operation
process and assure the assorted qualities of the population. The simulated annealing algorithm has the strong
local search capability and is equipped for getting away from local optimal solutions. Anyway GAs is prone to
premature convergence and be trapped in local optimal solutions. Likewise, the SA requires more reckoning
time. Thus, by the synthesis of the two algorithms, aModified Genetic Algorithm-Simulated Annealing
algorithm is demonstrated in this area.
In general an allied methodology of GAs and the SA is to house the SA inside GAs. The SA enhances each
individual from GAs populations with an iteration number that is obliged to achieve Markov chain length.
Along these lines, the accepted GA-SA takes significantly more execution time than GAs or the SA. To defeat
this inadequacy, this study enhances the customary GA-SA algorithm. The enhanced algorithm changes the
optimal method of the SA to the GAs population, that is, the SA just enhances the optimal individual of GAs
population, not all people. After the change, the algorithm can spare substantially more execution time than the
customary GA-SA. Additionally, the MGASA is equipped for attaining better results than other improvement
strategies.
MGASA Algorithm:
GA Phase:
Step 1: Initialize population and temperature.
Step 2: Evaluate the population
Step 3: Repeat
Apply selection operator
Apply crossover operator
Apply mutation operator
Evaluate population
Until termination condition is met
379
S.Kopperundevi and DR.A.Iyemperumal, 2014
Australian Journal of Basic and Applied Sciences, 8(9) June 2014, Pages: 375-382
SA, Phase:
Step 4: Select best optimal solution from GA
Step 5: Evaluate the objective function.
Step 6: Repeat
Generate new neighbourhood solution
Estimate fitness function
Accept new neighbourhood based on metropolis criteria
Until ( max solutions to be considered for each single iteration)
Step 7: Decrease the temperature using the annealing schedule.
Step 8: Repeat steps 6-7 until stopping criteria is met.
The MGASA algorithm comprises of two stages, the GA stage and the SA stage. In the IGA-SA algorithm,
Initially GAs creates the initial population randomly. The GA then assesses the initialpopulation and works on
the population utilizing three genetic operators to process new population. After every generation the GA sends
the best individual to the SA in phase II for further change. Having completed the further change of the
individual, the SA sends it to the GA for the following generation once more. This methodology proceeds until
the termination condition of the algorithm is met.
Phase 1 Optimal genetic algorithm process:
The GA produces stochastically the initial population and afterward operates on the population utilizing
three genetic operators to prepare new population. As per pseudo code of the genetic algorithm, a few parts in
respect to GAs ought to be resolved, for example, the choice variables, the population estimate, the generation
ofthe initial population, the assessment of population, the plans of encoding and interpreting for chromosomes,
the determination of genetic operators and the termination condition.
Objective Function:
The objective is to decrease the forecasting error of oil and gas stock price. The objective function can be
written as:
𝑅𝑀𝑆𝐸 =
𝑛
2
𝑖=1 𝐴−𝑃
𝑛
Where „n‟ is the population size, A is the actual price and P is the predicted value.
Generate Initial Population:
The initial population is produced randomly. Each of Initial weights is randomly created between -1 and +
1.
Fitness Function:
GAs assesses the population dependent upon the fitness function. An individual with higher fitness rate has
higher opportunity to be chosen into the following generation. Generally the fitness of a string is with respect to
the target function.
𝑅𝑀𝑆𝐸 =
𝑛
𝑖=1
𝐴−𝑃
𝑛
2
Selection Procedure:
We utilize truncation selection for selecting the population. In truncation selection people are sorted as per
their fitness. Just the best individuals are chosen for individuals. The truncation limit shows the extent of the
population to be chosen as individuals. At that point we utilize a binary truncation selectionfor producing new
offsprings by utilization of genetic operators. In truncation selection, two members of the population are chosen
as arbitrary and their fitness contrasted and the best one concurring with fitness worth will be decided to one
parent. Likewise an alternate parent chosen with the same technique.
Genetic Operators:
Here, we utilize two-point crossover and one-point mutation as genetic operators.
Replacement:
The present population has been replaced by the recently produced offsprings, which structures the
next generation.
Termination Criteria:
If the number of generation equivalents the maximum generation number then stop.
380
S.Kopperundevi and DR.A.Iyemperumal, 2014
Australian Journal of Basic and Applied Sciences, 8(9) June 2014, Pages: 375-382
Phase 2 Optimal Simulated Annealing Process:
In the methodology of the MGASA, the GA will send its best individual to the SA for enhancement. After
the optimal individual of the GA being enhanced, the SA passes it to the GA for the subsequent generation. This
methodology proceeds until the termination condition is met.
Initial Temperature:
The SA accepts new states dependent upon Metropolis criterion which is a stochastic procedure . The
criterion is given by P(e)= min{1, exp(−δe/t)}, where δe =f(s i)−f(sj) is the difference of the objective function
values of the new state si and the present state sj, and t is the present temperature. Assuming that δe is not
exactly zero, then the new state is held and the present state is discarded. Overall, the new state may be held if
the Boltzmann likelihood,Pb=exp(−δe/t), is greater than an arbitrary number within the range 0 to 1. At a high
temperature, the SA can accept another state that has a higher value than that of the past unified with a
substantial likelihood. As cooling proceeds, the state may be accepted by the SA with a less likelihood.
Cooling Rate:
The performance of the SA is relative with respect to the cooling rate. So as to enhance the consistency and
the search effectiveness of the SA, an enormous cooling rate ought to be maintained. In the event that the
cooling rate of each temperature change counter is excessively low, the SA will cost reckoning time
expenditure. On alternate hands, if a faster cooling rate is utilized, the likelihood of getting trapped into a local
minimum is higher. In general, the value of cooling rate may be controlled by its sensitivity analysis. The
cooling schedule is given as follows:
Tk = γ Tk-1
Where Tkand Tk-1 are temperatures at time k and k-1; γ is the cooling rate between 0 and 1.
Number of Transitions at a Temperature:
In a search methodology of the SA, the state move at every temperature change counter is just dependent on
the new states and current status. Hence, the search procedure of SA could be acknowledged as a Markov chain,
whose length is characterized by the amount of moves permitted at the current temperature. The amount of
moves at each temperature is characterized as:
Rt= αt
R is the maximum number of repetitions at a particular temperature, α is a constant variable.
Generation of neighbourhood structure:
The focus of neighbourhood structure generation is to change arbitrarily the present state to an feasible
range of its current value. There are numerous diverse approaches to generate the neighborhood structure. In the
present work, the non-uniform transformation approach in the GA is received with some adjustment for
generation methodology. In the event that a uniform arbitrary number distributed in the range [0,1] is less than
the mutation Pm, the present choice variable is permitted to transform its value randomly. Otherwise, the present
decision variable is not permitted to do that.
Termination Condition:
The algorithm runs until the last generation or when the low RMSE value is reached.
Simulation Study:
Experimental Data:
The research information utilized within this study is BSE oil and gas stock index from 1 January 2010 to
31 December 2014. We gather a sample of 48 trading months; we pick 60% for training phase and 30% for the
testing phase.
Numerous past stock market investigations have utilized technical indicators as characteristics. Technical
indicators are components that forecast the future performance of stocks in a given set of economic situations.
By and large technical indicators are utilized for short – term designs. They are regularly dependent upon
scientific estimations which take into consideration the current relationship between the stock price and the
general development of the market where the stock is exchanged. These indicators are ascertained dependent
upon fundamental qualities: closing price, opening price, high price, low price , all these prices speak to the
stock quality throughout the trading session.
In this research, we utilize the technical indicators as input variables. We pick seven technical indicators to
constrictionthe set of variables. These are calculated from the raw data as demonstrated (RitanjaliMajhi et al.,
2008).
381
S.Kopperundevi and DR.A.Iyemperumal, 2014
Australian Journal of Basic and Applied Sciences, 8(9) June 2014, Pages: 375-382
Performance Evaluation:
Training of the forecasting models utilize MGASA algorithm.Then, utilizing these weights the same
anticipating models are again utilized for the testing reason. The assessment is done to test the execution of the
model for forecasting the close price of the index.
The Mean Squared Error(MSE), Root Mean Squared Error(RMSE), R-Squared(R2), Adjusted Rsquared(RA2), Hannan-Quinn Information Criterion (HQ) are used to gauge the performance of the trained
forecasting model for the test data(Table 1).
Table 1: Performance Criteria and the related formula.
Performance Criteria
Mean Squared Error
Formula
𝑛
𝑀𝑆𝐸 =
𝑦1 − 𝑦2
2
𝑖=1
Root Mean Squared Error (RMSE)
𝑛
𝑖=1
𝑅𝑀𝑆𝐸 =
R-Squared(R2)
Adjusted R-Squared(RA2)
Hannan-Quinn Information Criterion (HQ)
𝑦1 − 𝑦2
𝑛
2
𝑛
𝑖=1
𝑛
𝑖=1
𝑦1 − 𝑦2 2
𝑦 − 𝑦2 2
𝑦 = real value, 𝑦1 = estimated value, 𝑦2 = mean value
𝑇−1
𝑅𝐴2 = 1 − (1 − 𝑅 2 )
𝑇−𝑛
𝑆𝑆𝑅 𝑘 ln
[ln 𝑛 ]
𝐻𝑄 = ln
+
𝑛
𝑛
𝑅2 =
SSR =
𝑛
𝑖=1
𝑦 − 𝑦1
2
Results:
In this paper data from 01-01-2010 to 31-12-2011 are utilized for training purpose and then predict the
stock close price of the year 2013 i.e, from January 2013 to December 201 and compare it with the closing data
of that year.
Table 2: Actual and predicted price using modified genetic algorithm simulated annealing.
Period(2013)
Actual
January
93.59
February
86.48
March
83.26
April
87.11
May
86.54
June
89
July
85.78
August
81.49
September
82.16
October
89.36
November
86.50
December
88.34
Predicted
94.19
87.93
83.38
87.97
86.89
89.95
87.11
82.33
82.98
90.12
87.02
88.57
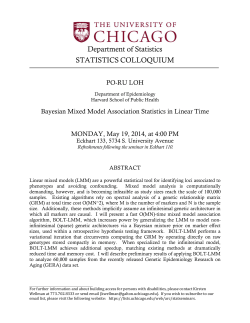
100
95
90
Actual
85
Predicted
80
75
Jan Mar May July Sep Nov
Fig. 1: Actual and predicted price using modified genetic algorithm simulated annealing.
Table 2 represents the actual value and the predicted value of the proposed approach. Fig 1 represents the
test results by plotting the actual value against the value predicted by using the proposed algorithm.
382
S.Kopperundevi and DR.A.Iyemperumal, 2014
Australian Journal of Basic and Applied Sciences, 8(9) June 2014, Pages: 375-382
Table 3: Error rate of the proposed algorithm using various test criteria.
Test Criteria
Mean Squared Error
Root Mean Squared Error (RMSE)
R-Squared(R2)
Adjusted R-Squared(RA2)
Hannan-Quinn Information Criterion (HQ)
Error Rate(%)
3.45
5.48
0.17
1.15
-5.03
Table 3 Shows the error rate of the proposed technique by using various methods. The proposed algorithm
performed the prediction better than the other investigated model.
Conclusion:
Now-a-days Oil and Gas corporation because of the increase in infrastructure investment, is an attractive
market for investment. Thus modelling a framework for stock price prediction in oil and gas corporation is vital
for all traders and financial consultants to decrease their risk and increase the benefit of the shareholders.
In this research, a Modified Genetic Algorithm-Simulated Annealing is used to predict the stock price of
Oil and Gas Corporation taken from Bombay Stock Exchange. The stock prices are estimated by the proposed
MGASA algorithm and the effectiveness of the proposed algorithm was validated on the original data. It is
observed that the proposed algorithm significantly outperforms resulting in more profits. Hence, it can be
concluded that the proposed algorithm is well suited for prediction of the stock prices.
REFERENCES
Abdüsselam Altunkaynak, 2009. Sediment load prediction by genetic algorithms Advances in Engineering
Software, 40(9): 928-934.
Beasley, D., D.R. Bull, and R. Martin, 2008. An Overview of Genetic Algorithms:. Part 1, Fundamentals.
Norwegian University of Science and Technology.
David Enke and Suraphan Thawornwong, 2005. The use of data mining and neural networks for forecasting
stock market returns, Journal of Finance, USA.
De,. E.L., Faria and J.L. Gonzalez, 2009. Predicting the Brazilian stock market through neural networks and
adaptive exponential smoothing methods, Expert Systems with Applications Article in Press.
Guresen, E., G. Kayakutlu, T.U. Daim, 2011. Using artificial neural network models in stock market index
prediction, Expert Systems with Applications, 38(8): 10389-10397.
Holland, J.H., 1975. Adaptation in natural and artificial system. The University of Michigan Press, Ann
Arbor, MI.
Huang, W., et al., 2005. “Forecasting stock market movement direction with support vector machine,”
Computers & Operations Research, 32: 2513-2522005.
Kirkpatrick, S., C.D. Gelatt, M.P. Vecchi, 1983. Optimization by simulated annealing. Science, 220: 671680.
RitanjaliMajhi, G., Panda, G. Sahoo, Abhishek Panda, ArvindChoubey, 2008. prediction of S&P500 and
DJIA Stock Indices using Particle Swarm Optimization Technique IEEE.
Roh, T.H., 2007. Forecasting the Volatility of Stock Price Index, Journal of Expert Systems with
Applications, 33: 916-922.
Shaikh, A., Hamid and Zahid Iqbal, 2003. Using neural networks for forecasting volatility of S&P 500
Index futures prices, School of Business, USA.
Zhang Yudong and Wu Lenan, 2008. Stock market prediction of S&P 500 via combination of improved
BCO approach and BP neural network, Expert Systems with ApplicationsVolume 36, Issue 5, Pages 8849-8854.
Sheng-Hsun Hsu and J.J. Po-An Hsieh, 2008. A two-stage architecture for stock price forecasting by
integrating selforganizing organizing map and support vector regression, Expert Systems with Applications, 36
(4): 7947-7951.
Vatsal, H., Shah “Machine learning techniques for stock prediction,” www.vatsals.com.
© Copyright 2026 ExpyDoc