Expy
Doc
Explore Categories
Log in
Create new account
No category
Detailed Guidance Sheet - FINAL.xlsx
Download
Report
S. Polydoras, C. Provatidis, T. Vasilopoulos, E. Theodorou, G
ORDER DATE DELIVERY DATES ORDER DATE DELIVERY DATES
2015-16 Peshtigo School District Calendar (Board Approved: 2-11-15)
CLOVIS UNIFIED STUDENT CALENDAR 2015
RDN Solid waste Management Plan Review
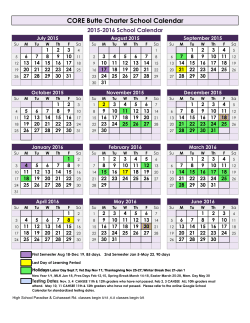
2015 2016 Calendar for Web - CORE Butte Charter School
2015-2016 School Year - Cleveland City Schools
Presentation to Investors 9 months 2014 IFRS Results Update
auction brochure -11 feb 2015 - jacketed kettles (pdf)
2015-16 Single Page Calendar - William Floyd School District
Kansallinen palveluväylä National Data Exchange Layer
© Copyright 2026 ExpyDoc
About ExpyDoc
DMCA / GDPR
Report